> For the complete documentation index, see [llms.txt](https://help.tillit.cloud/tillit/llms.txt). Markdown versions of documentation pages are available by appending `.md` to page URLs; this page is available as [Markdown](https://help.tillit.cloud/tillit/knowledge-base/everyday-usage/overview.md).
# Layout Overview
Let's get familiar with the app layout and some key operations.
## Main Overview
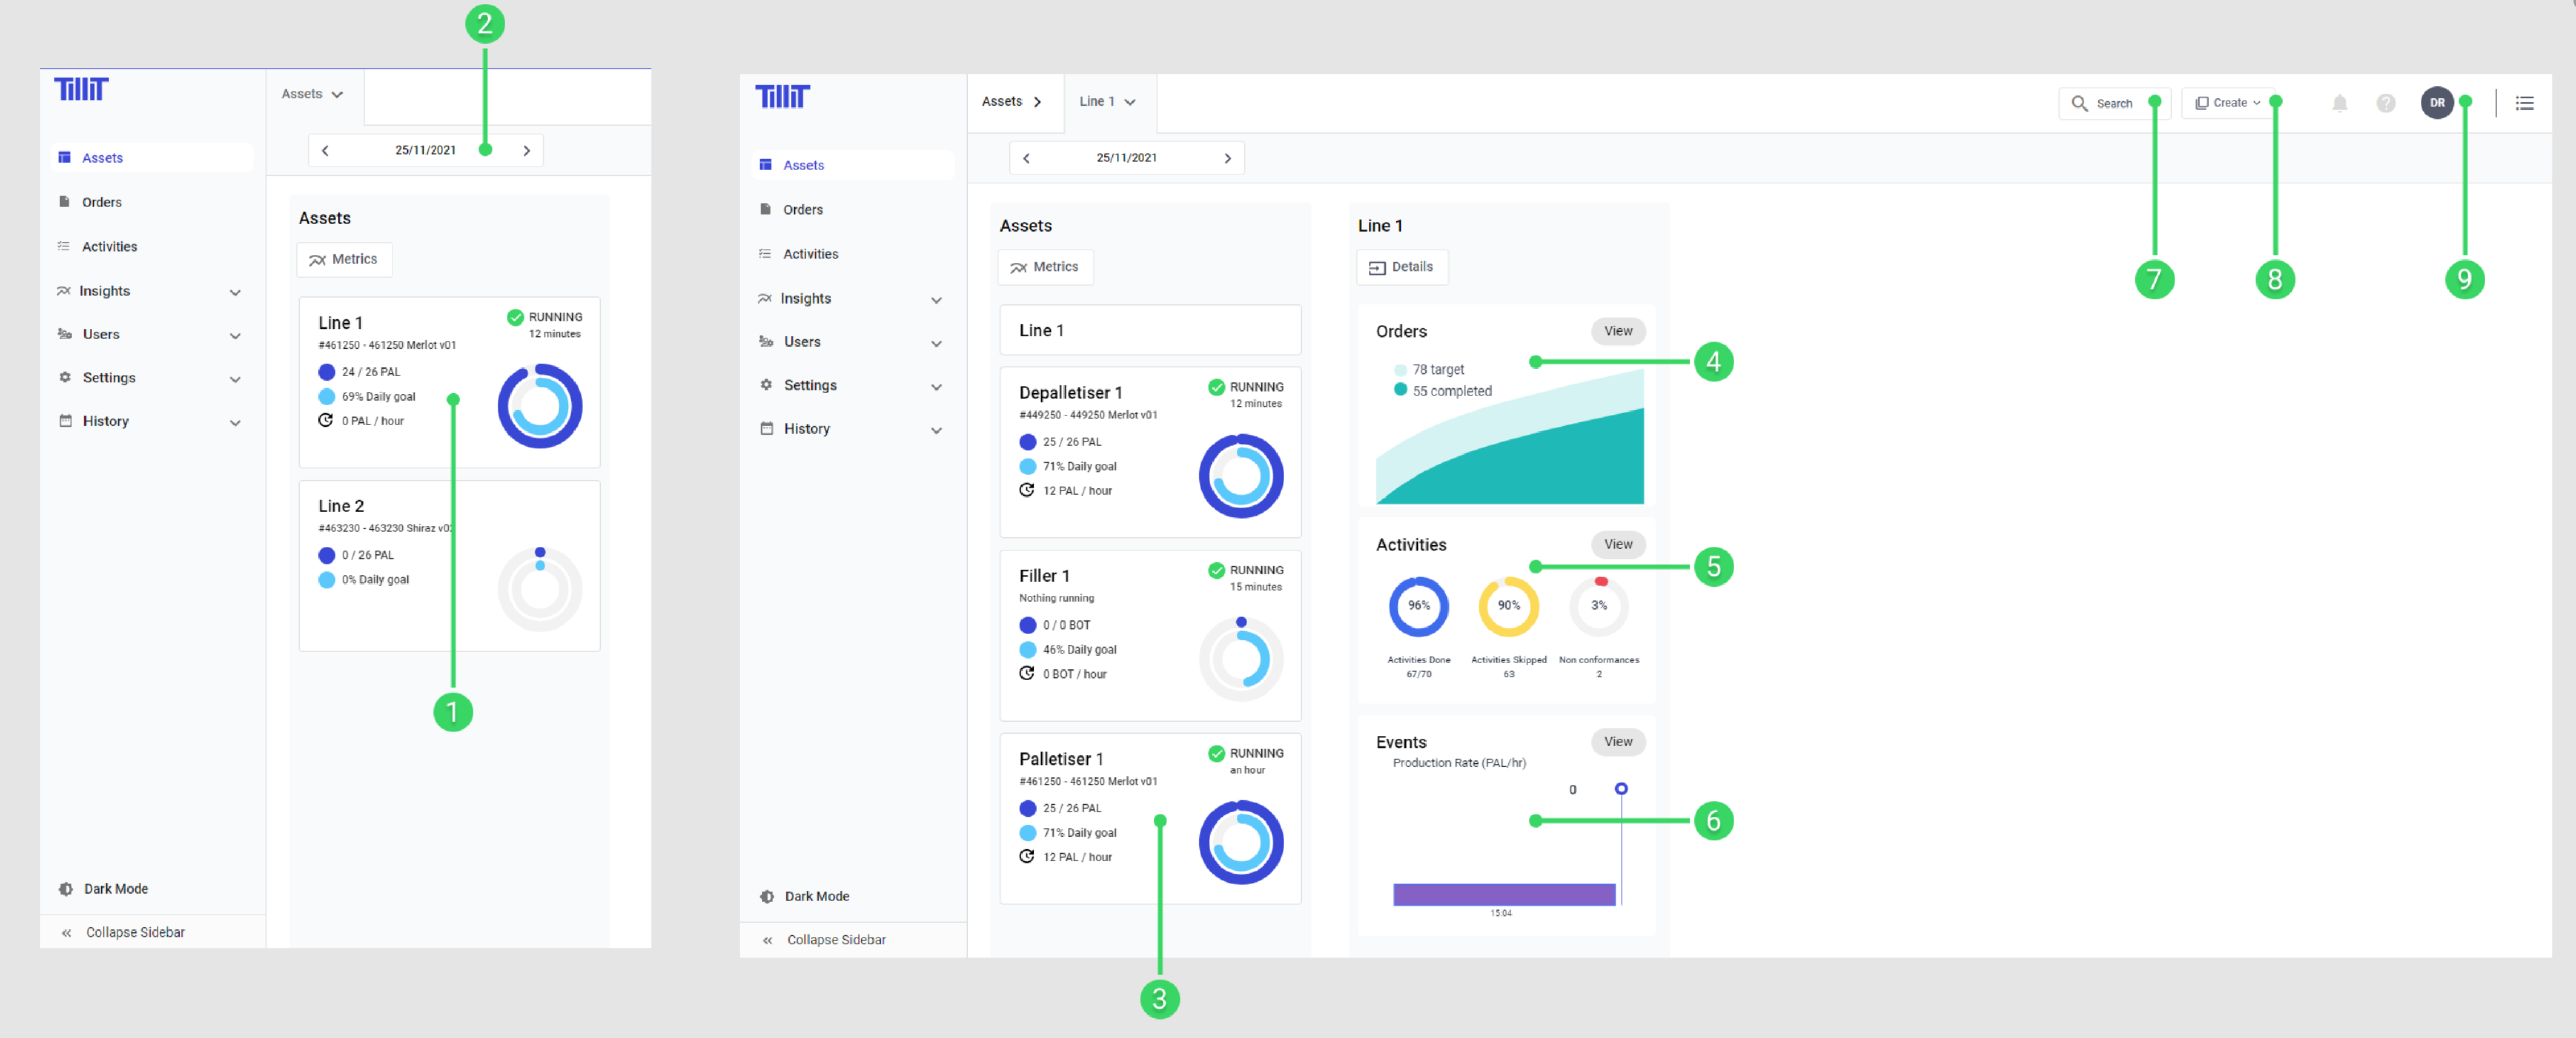
1. **Line** Asset, this represents each of the lines. Selecting a Line will show all Assets inside that Line. (Please note you do not have to have Lines)
2. Selected **Date**
3. **Asset**, selecting this will display the Asset panel.
4. **Orders**, shows target and completed units for the current order. Selecting this will display a list of Orders for this Asset.
5. **Activities**, are the list of tasks that need to be completed for an Asset. Selecting this will display a list of Activities for this Asset.
6. **Events** are a record of critical incidents, such as stoppages, activity expirations and non-conformities.
7. **Search** for orders and assets.
8. Create **manual** orders, events and activities.
9. Options dropdown, sign-out, lock and change sites.
## Quick Search
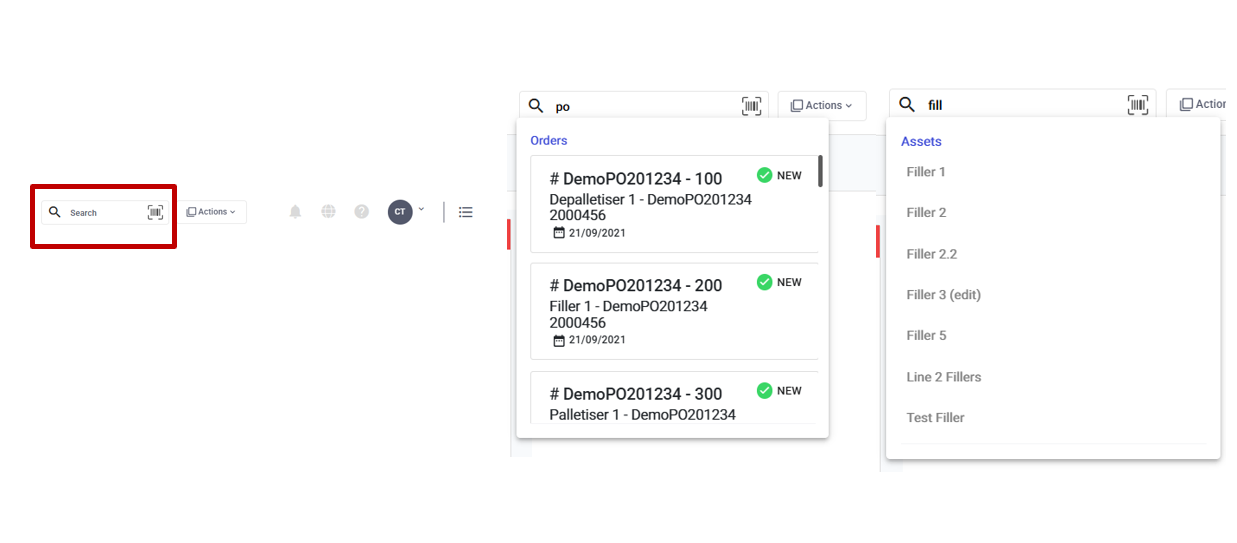
The Quick Search on the top-right of the UI allows you to quickly search for any running orders or assets and will navigate directly to them when clicked.
## Assets & Orders
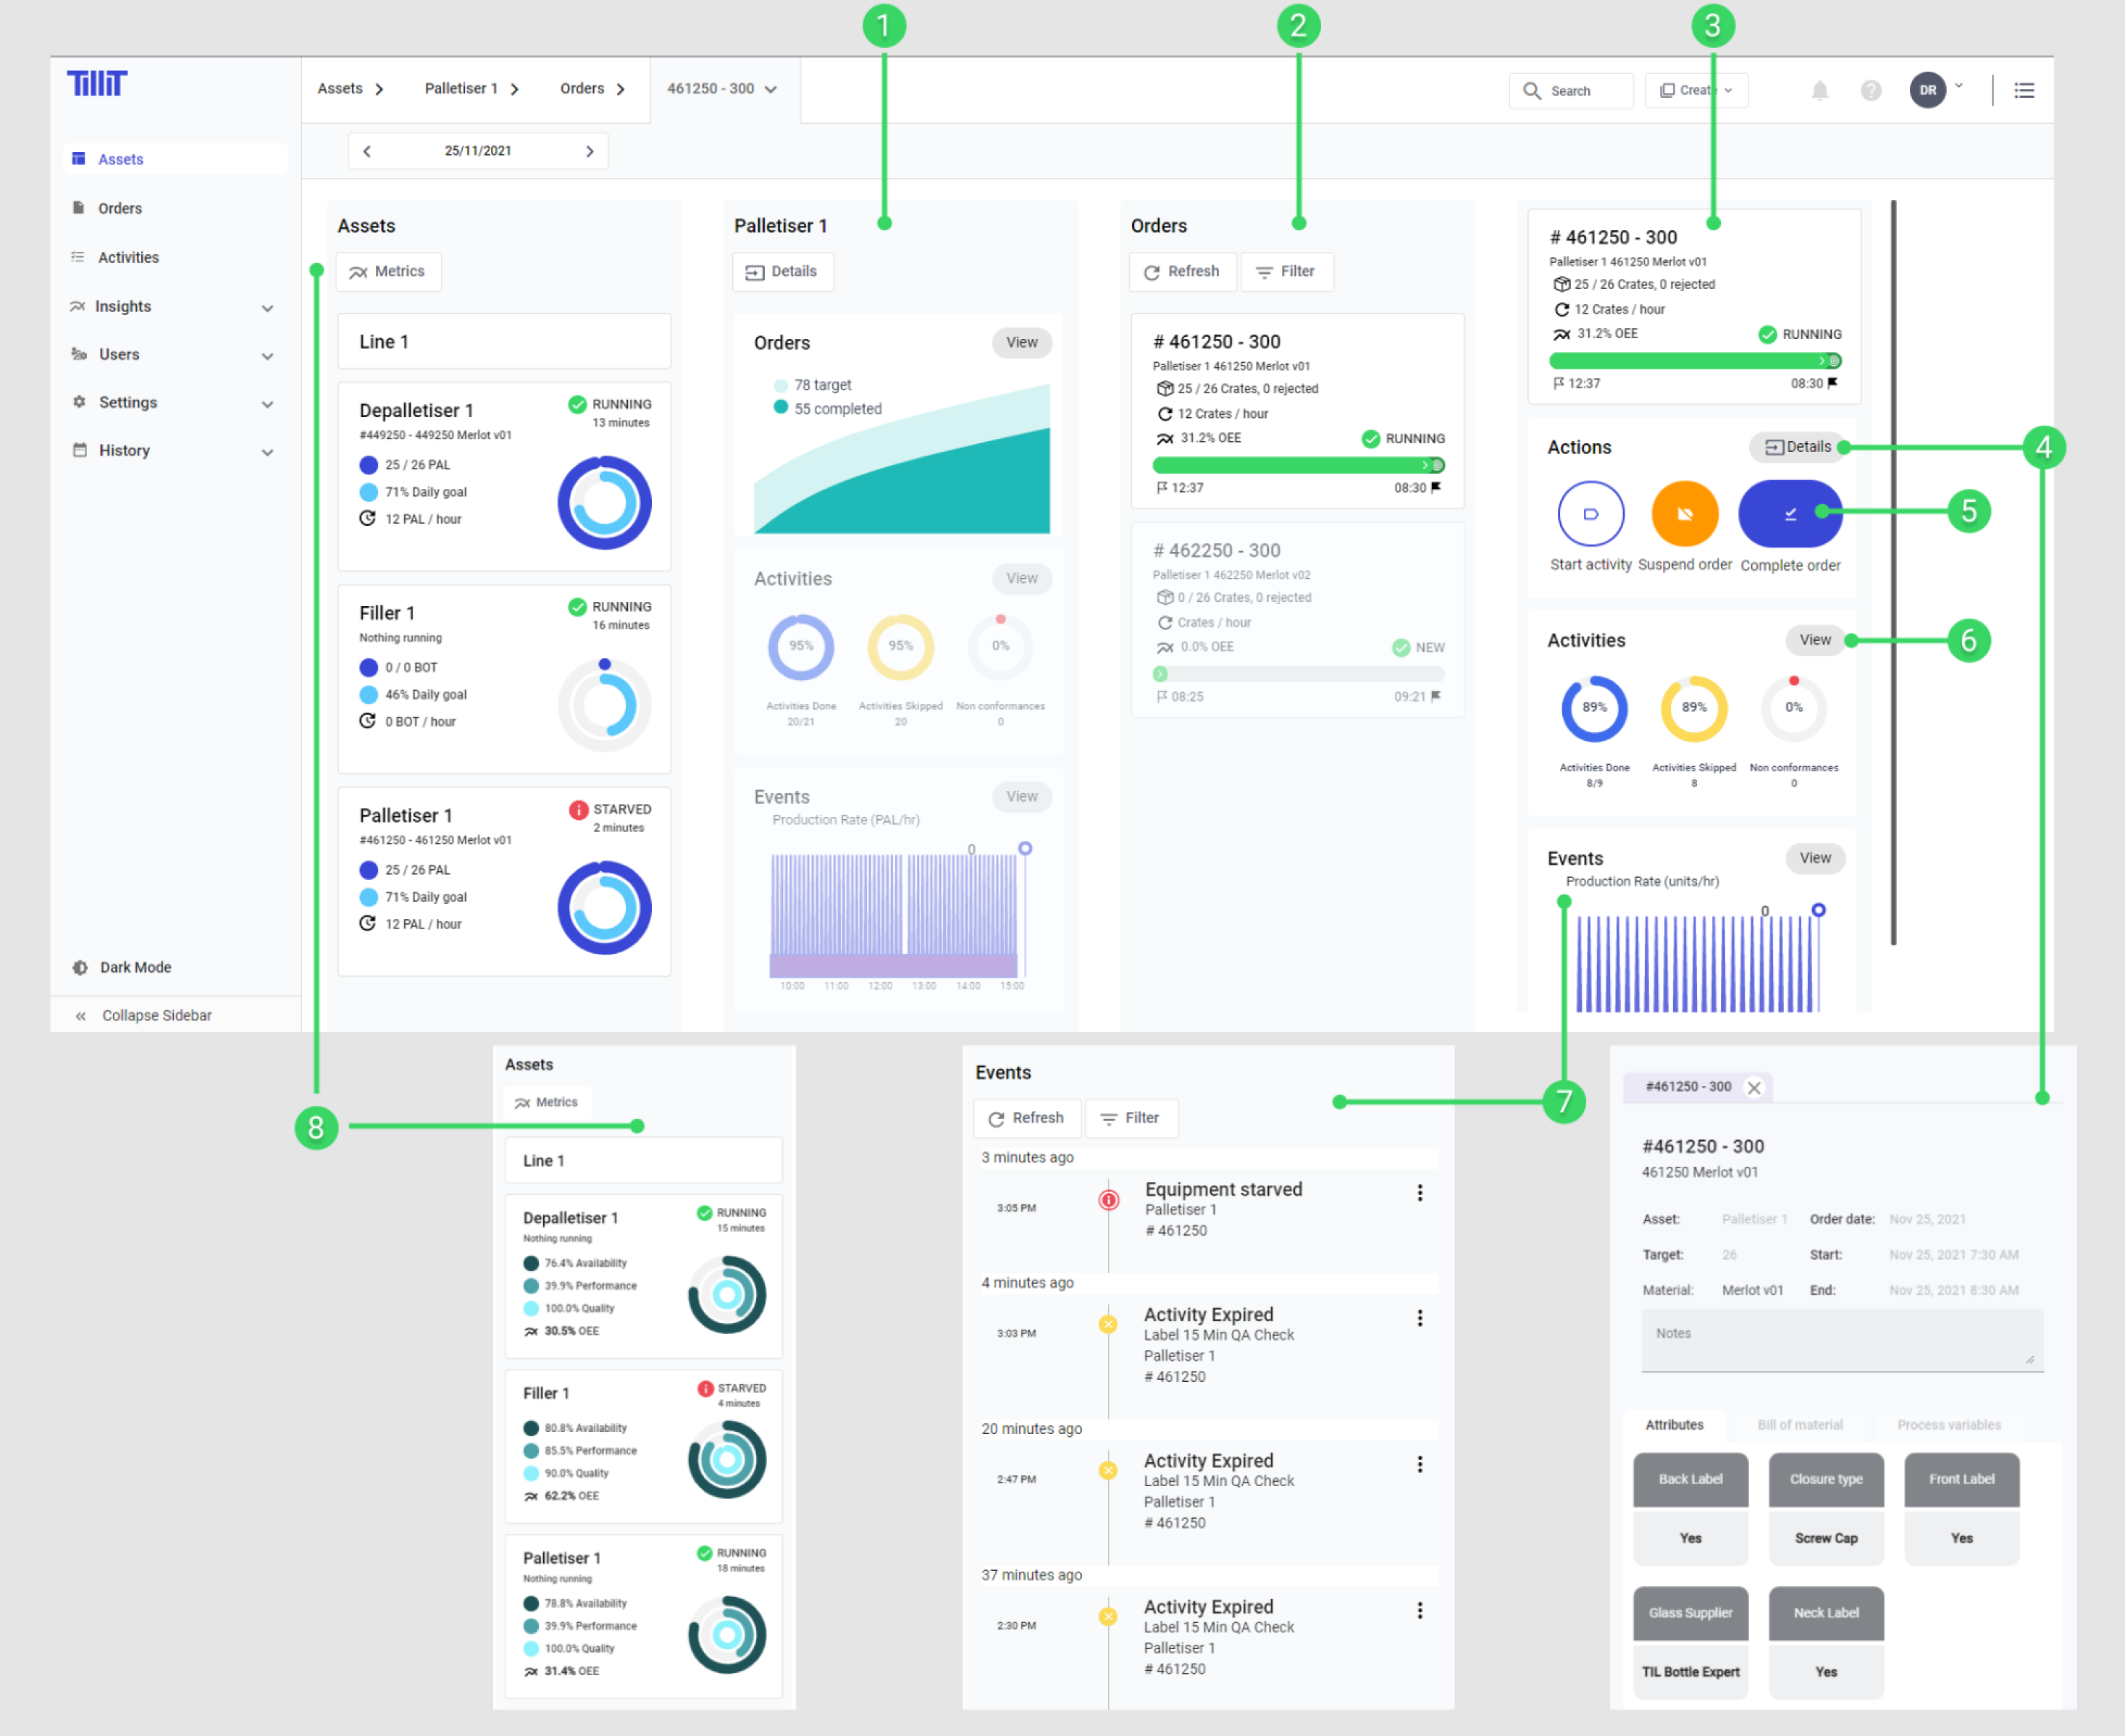
1. Selected **Asset** overview.
2. **Order** list, this can be filtered to show/hide Orders with different statuses.
3. Order overview
4. **Order** details, contains all information about an order.
5. Order **status**, update the Order status.
6. **Activities**, are the list of tasks that need to be completed for an Asset. Selecting this will display a list of Activities for this Asset.
7. **Events** are a record of critical incidents, such as: stoppages, activities expiring and non-conformities.
8. **Metrics** toggle, switch between **OEE** and **Production statistics**.
### Asset Details
When clicking on an asset's details, a side panel will open with different tabs that show different information about the asset.
The tabs are
* **Attributes -** which shows different [Asset Attributes](/tillit/knowledge-base/setting-up-tillit/asset-hierarchy/assets/attributes.md)
* **Materials** - associated materials and material movements
* **Activity Results -** of activities done on the asset
* **Process Variables -** which shows the asset's [Process Variables](/tillit/planning/data-gathering/configurations.md)
* **Articles** - allows users to upload and access documents associated with the asset, including manuals, work instructions, procedures, specifications, and other reference materials
* **Downtime Events** - which shows a downtime event associated with the asset. You can filter them by Active, Short or Long Stop, Event Type, or as well as if they are assigned. You can also split these events
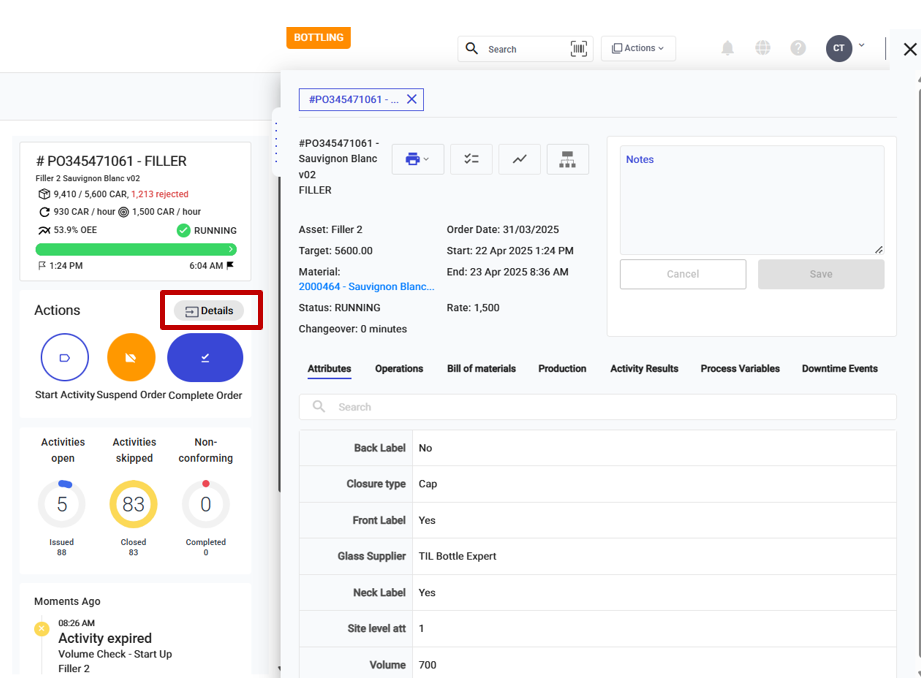
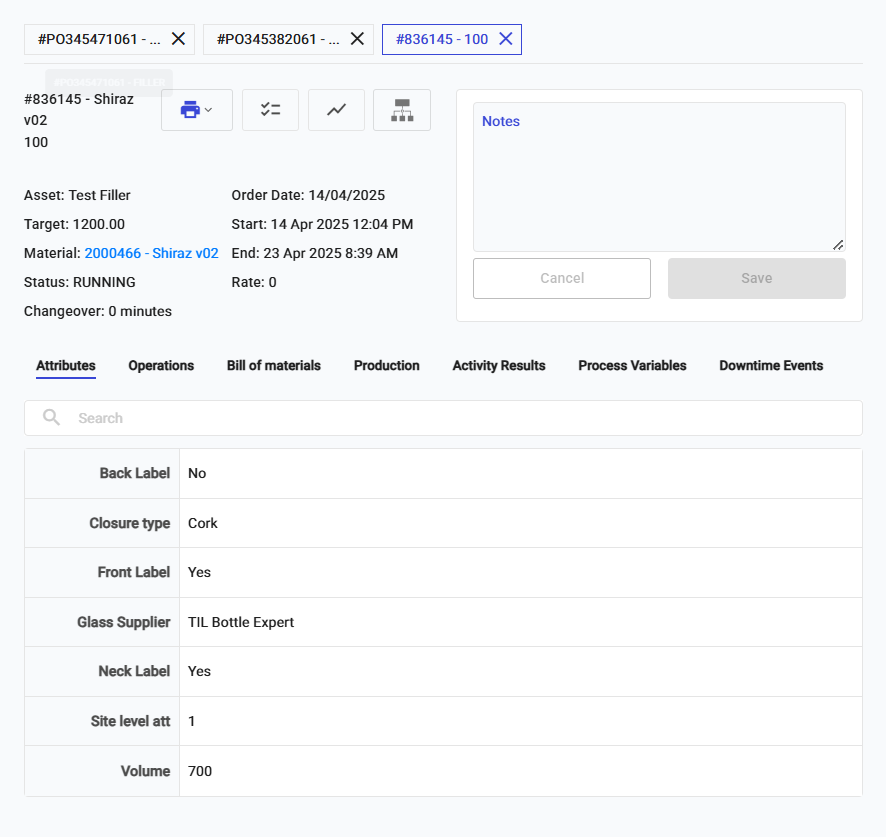
### Order Details
When clicking on an order's details, a side panel will open with different tabs that show different information about the order.
The tabs are
* **Attributes -** which can be either Order Attributes or Order Number Attributes from [Attributes](/tillit/planning/data-gathering/attributes.md)
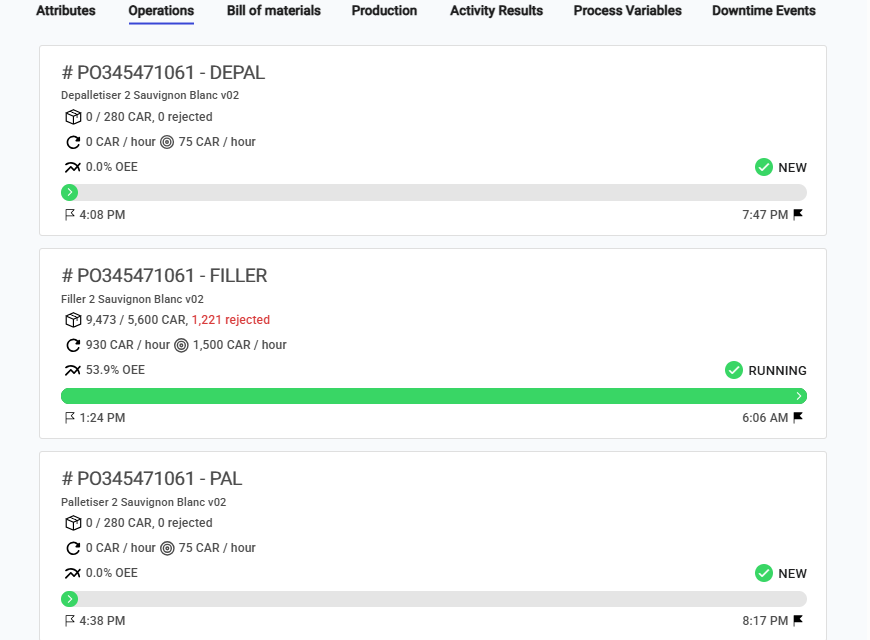
* **Operations** - of the same order number. See [Order Template](/tillit/knowledge-base/setting-up-tillit/asset-hierarchy/order-template.md) to configure
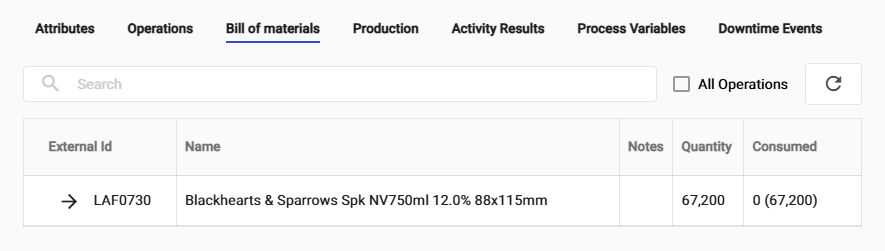
* **Bill of Materials** - associated with producing this order
* **Activity Results -** done for this order
* **Process Variables** - associated with this order
* **Downtime events** - occurred while producing the order
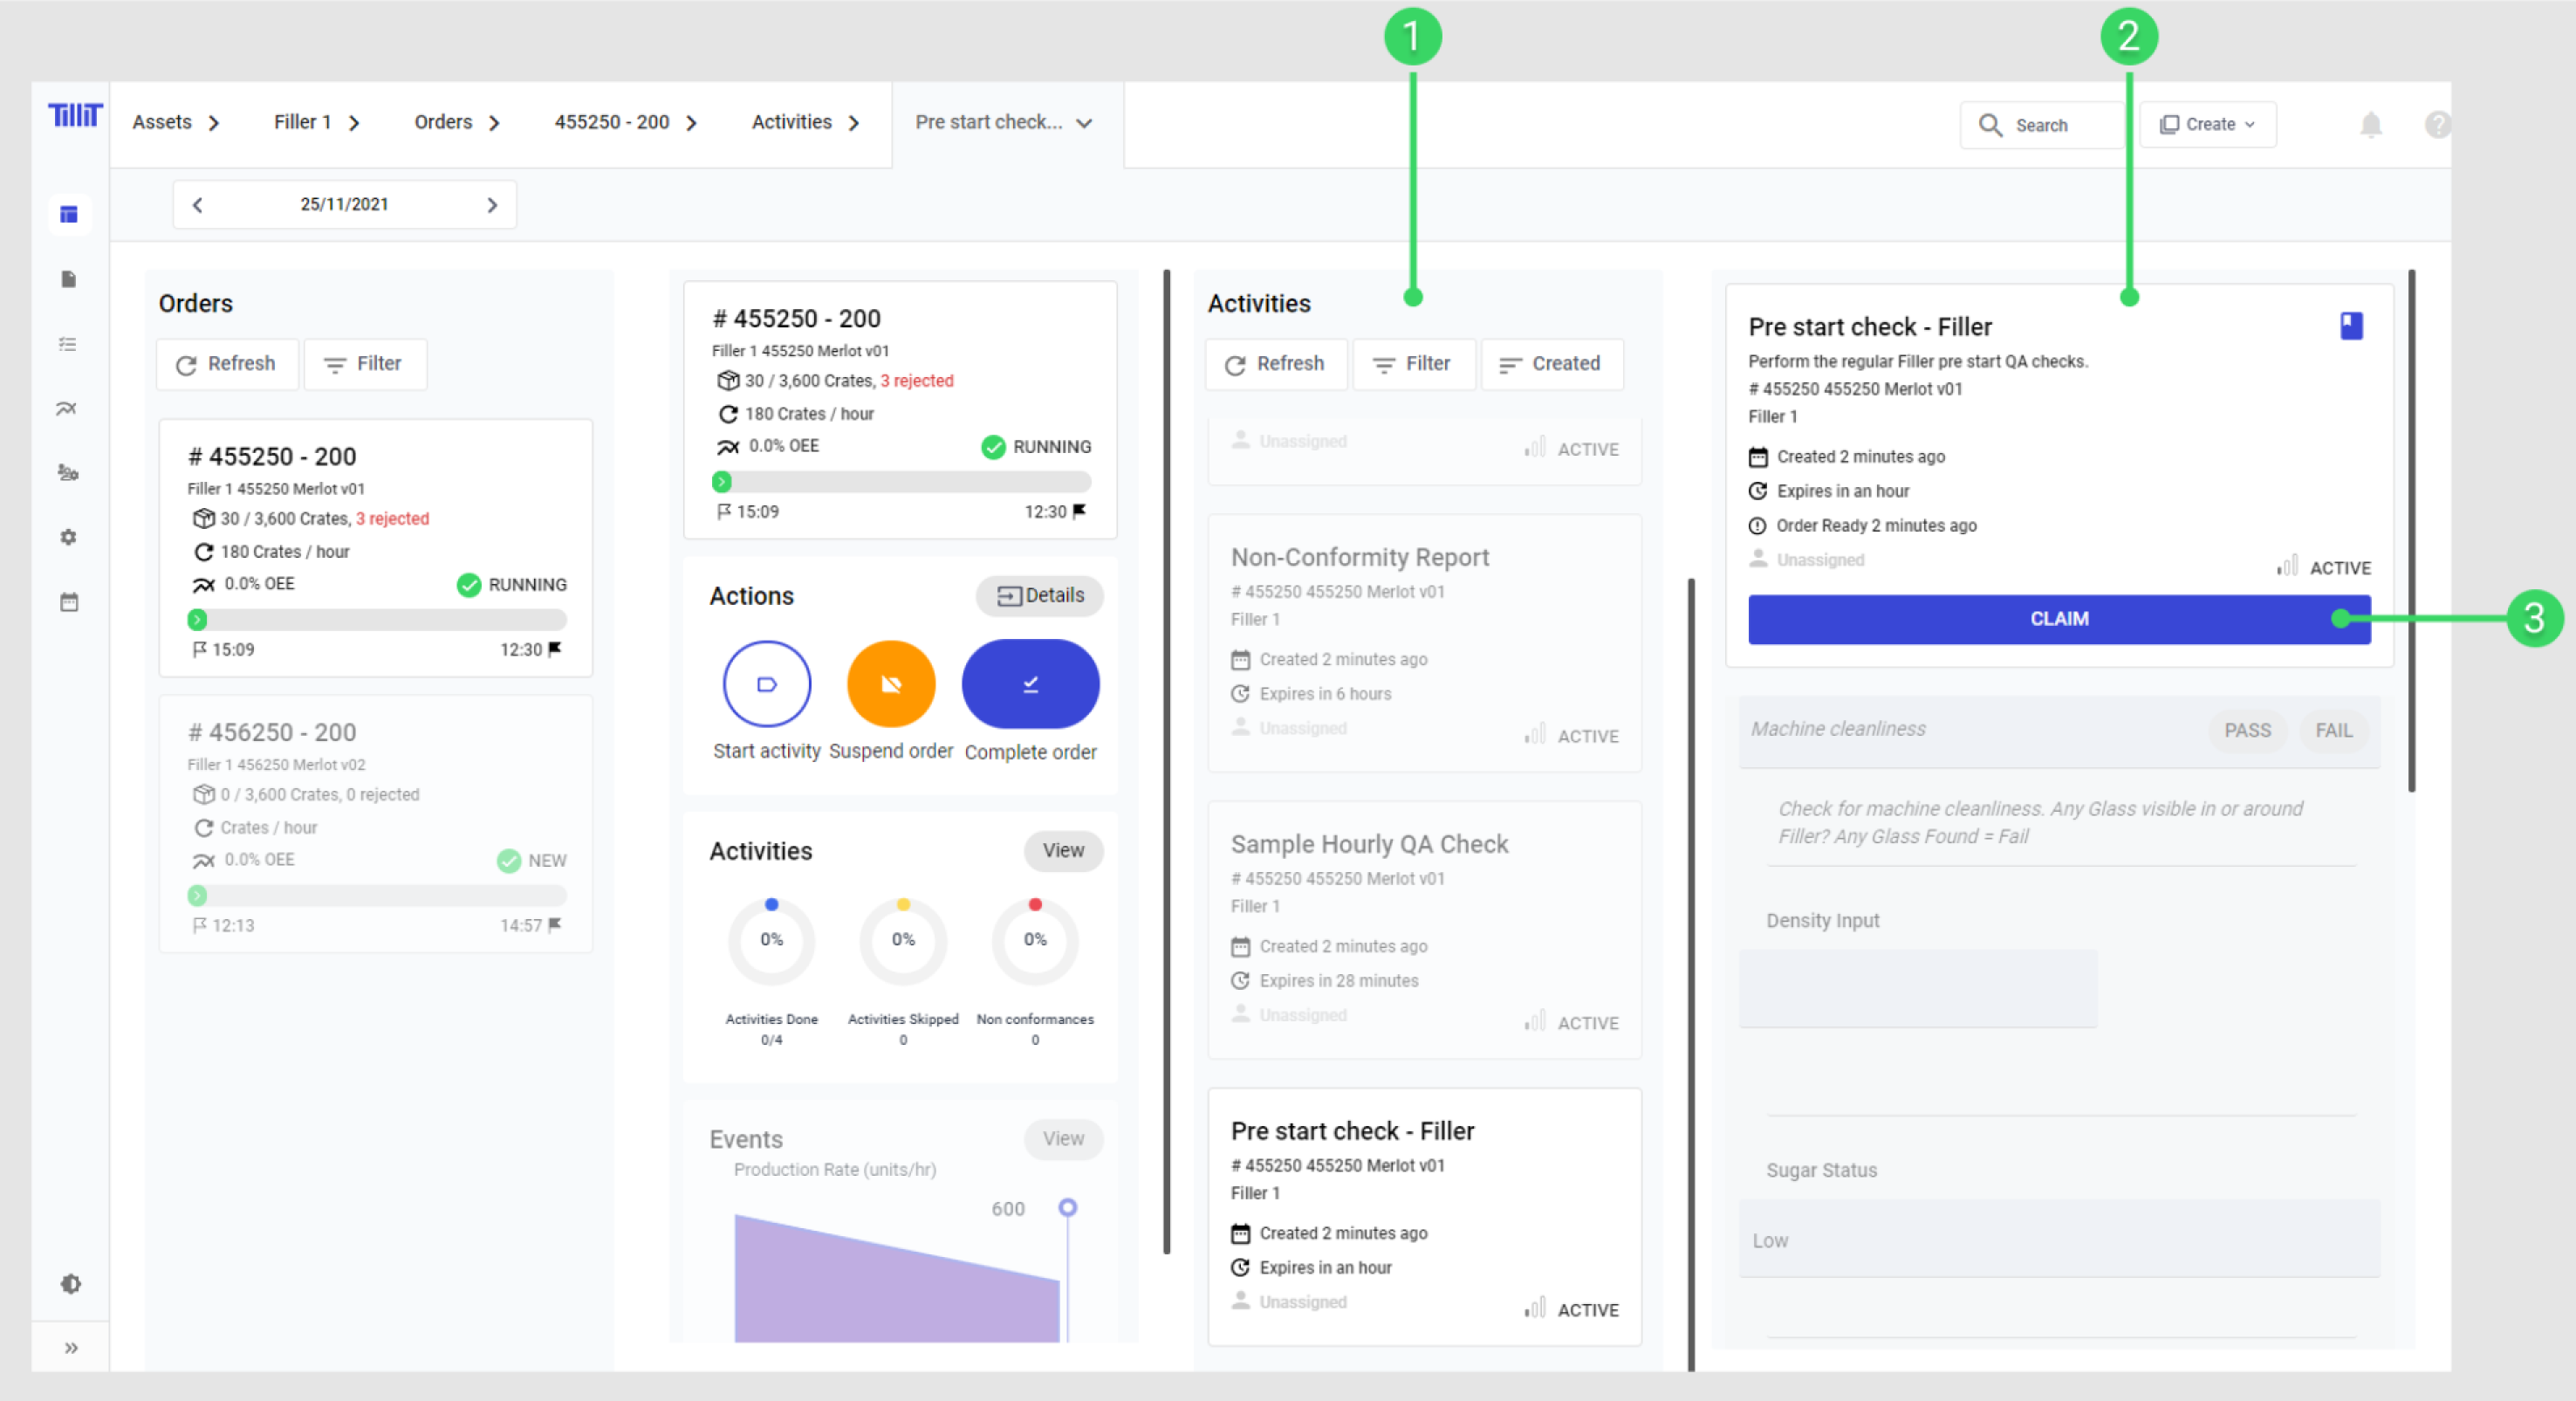
## Activities
1. **Activities** List, this can be filtered and sorted using the 2 buttons up the top.
2. Selected activity.
3. **Claim** activity, this will allow you to enter required data and complete the Activity.
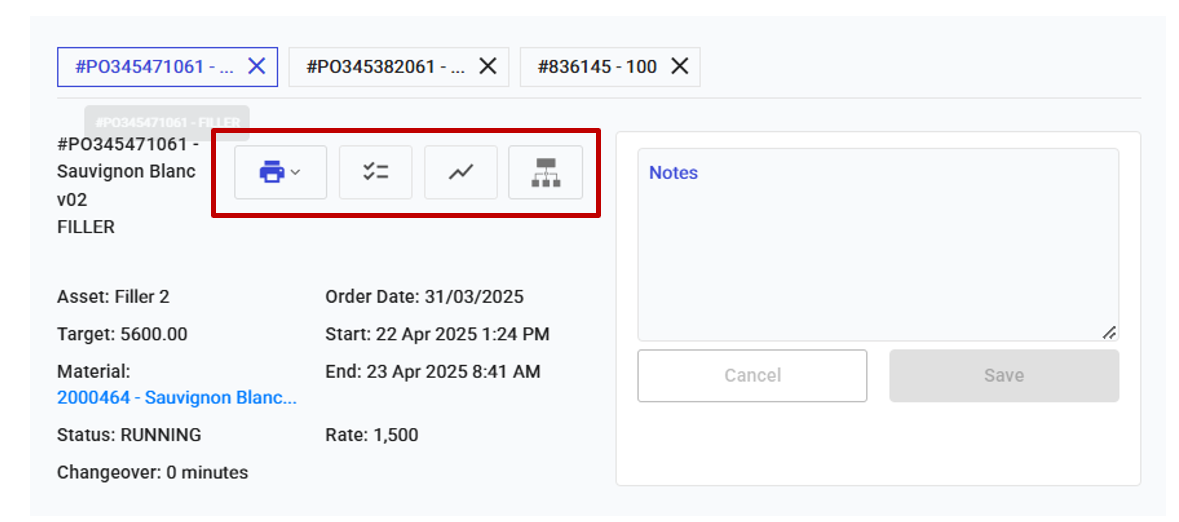
You can also navigate to reports from this view using these buttons, their functionalities are as follows:
* Print an Order Report
* Go to [Activity report](/tillit/knowledge-base/reports/activity-report.md)
* Go to [Production Report](/tillit/knowledge-base/reports/production-report.md)
* View the Activity Model of the production of the Order\

## Station View
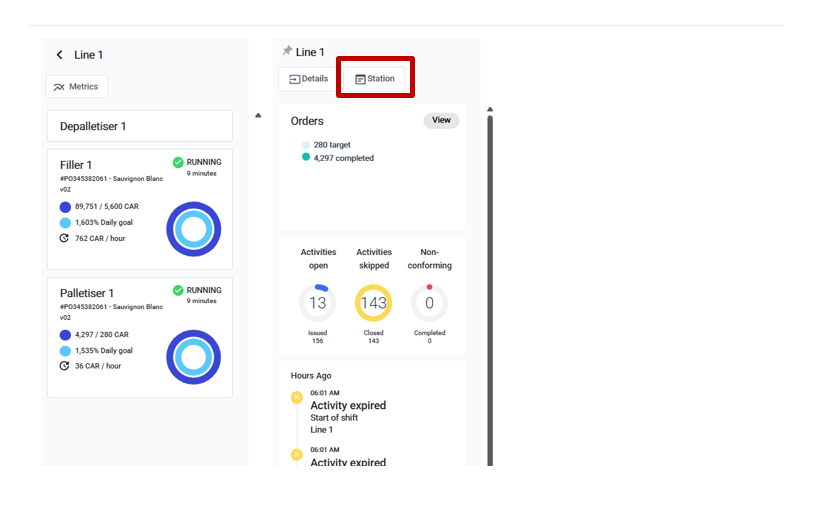
When a device running TilliT is dedicated to a single Asset/Equipment, then Station view offers an improved UX which prevents the overhead of navigating between assets. Click on Station View or on a Pinned Asset to be brought into the view.
{% embed url="" %}