> For the complete documentation index, see [llms.txt](https://help.tillit.cloud/tillit/llms.txt). Markdown versions of documentation pages are available by appending `.md` to page URLs; this page is available as [Markdown](https://help.tillit.cloud/tillit/knowledge-base/reports/dashboards.md).
# Dashboards
## Dashboards
{% hint style="info" %}
Note: SUPERVISOR role or above needed to access Insights menu.
{% endhint %}
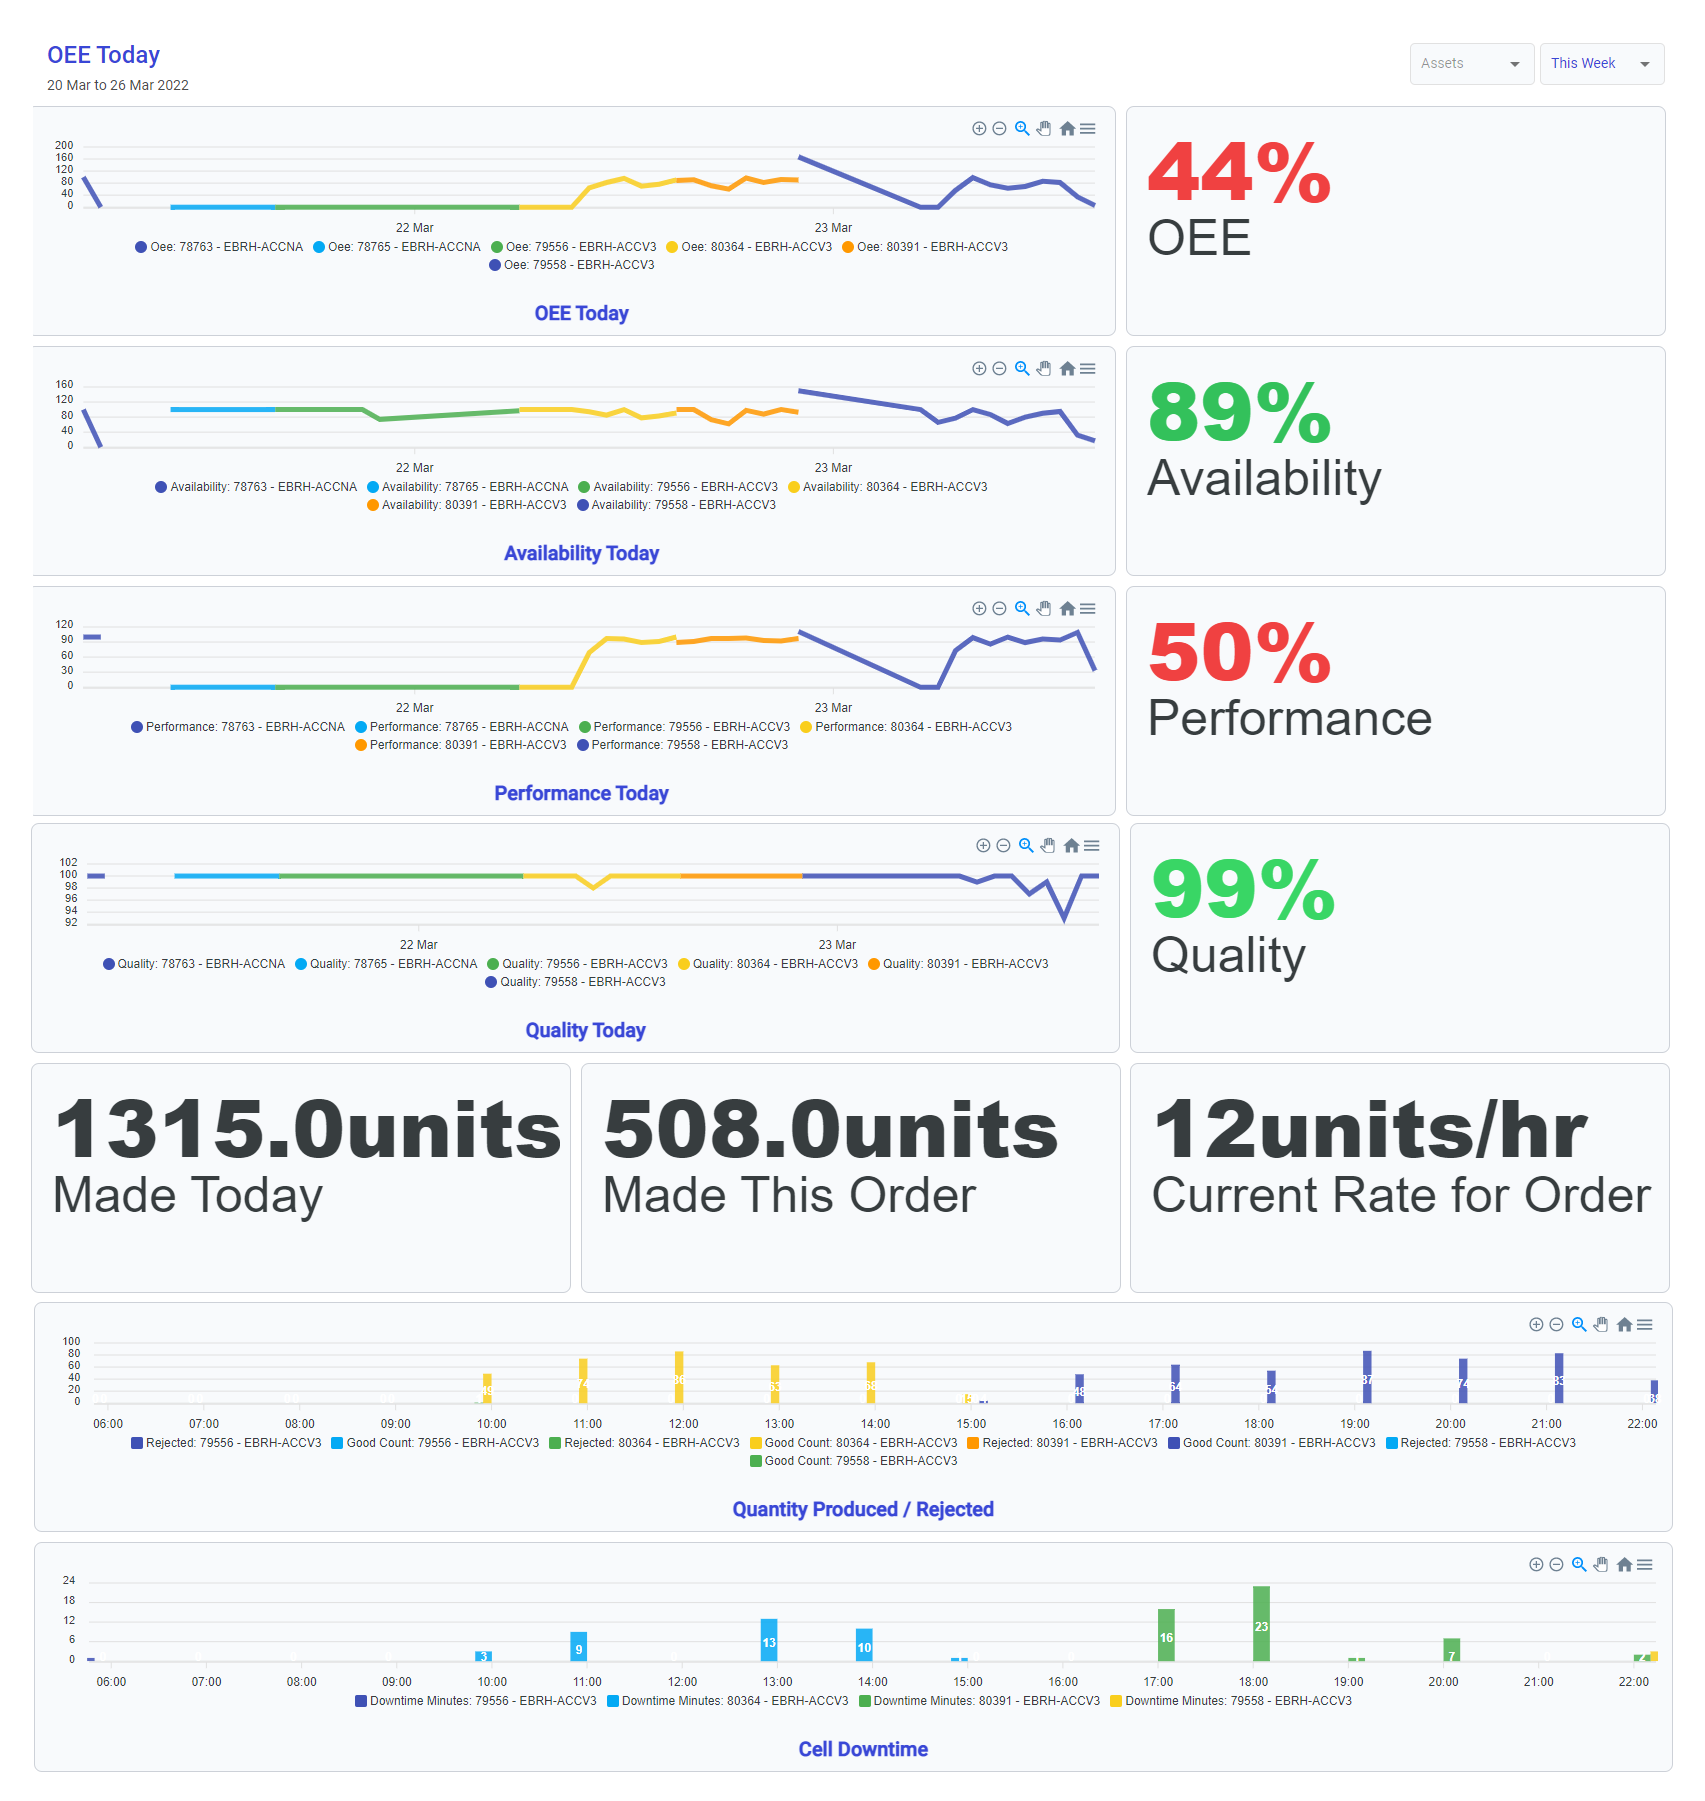
Get more out of TilliT the more you put in! TilliT allows customisable dashboards to be created. These dashboards are key to providing insights, allowing your business to quickly understand and respond to changing business scenarios. Here is one example of what you can build:
## Create Dashboard Group and Dashboard
Inside Settings -> Config -> Dashboard Groups
* Create a dashboard group (e.g. Production)
* Then create a dashboard inside the group (e.g. Line 1 Production)
### Setting up a Dashboard Element
Navigate to Insights -> Dashboards -> your Dashboard Group and click on your dashboard
{% stepper %}
{% step %}
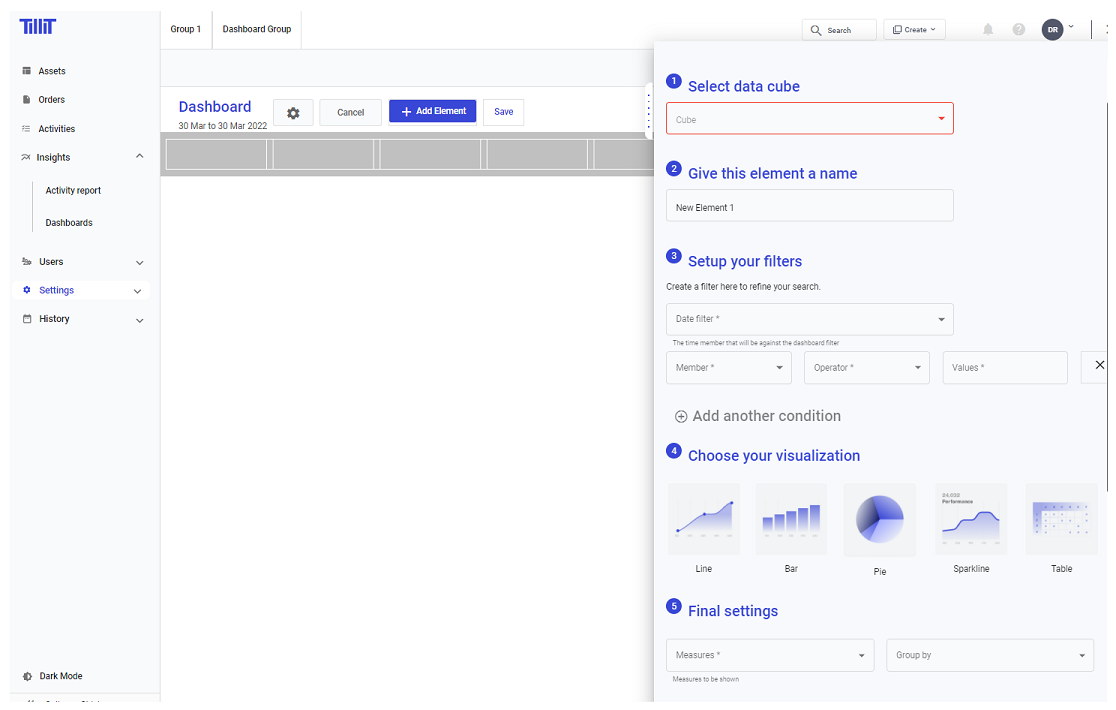
#### Select Data Cube
* Production – information such as quality, performance, availability, stoppage, run rates, order/stoppage durations, oee. For production lines, use Line Level Performance to calculate OEE at the line level by measuring output from assets representing production and availability from assets representing performance.
* Activity – information around activities issued
* Activity Items – information about data entered inside activity forms
* Events – information around events such as equipment running, stopping faulting, etc.
* Time Series – information for process variables
* Give this element a name
{% endstep %}
{% step %}
#### Setup your filters
* Apply a date filter
* Add another condition to show an additional filter where you can refine your element to show information for a specific asset, order or event
* Add additional filters to further refine the displayed results
{% endstep %}
{% step %}
#### Choose your visualisation
* This allows for different charts/tables
{% endstep %}
{% step %}
#### Final Settings
* Measures – Select the actual fields to display in the element (based on the data cube selected in step one). You can select multiple fields to display
* View by - Some form types have this option to choose what field is displayed on the X-axis
* Group by – This is used to group results.
{% endstep %}
{% endstepper %}
**Preview your changes before saving**
{% hint style="info" %}
**Tips**
* Hover over the dashboard name and **click** the pencil icon that appears
* Once in edit mode you can rearrange elements by dragging them
* You can edit elements by using the edit icon next to its name
* When editing an element you can duplicate it by using the button at the top of the edit dialog
* Charts such as the bar and pie allow you to hide certain results by clicking on an items name (inside the element)
{% endhint %}
## Configuring Dashboard Element Scale
When displaying chart visualisations on your dashboard, you can control the Y-axis scale to ensure your data is displayed optimally.
### Setting the Y-Axis Maximum
1. Navigate to ***Insights > Dashboards*** and select the dashboard group containing your dashboard
2. Click the pencil icon next to your dashboard name to enter edit mode
3. Click the edit icon next to the chart element you want to configure
4. In the element configuration panel, locate the ***Y-Axis Maximum*** field
5. Enter the maximum value you want to display on the Y-axis
6. Click ***Preview*** to see how your chart looks with the new scale
7. Click ***Save*** to apply the changes
{% hint style="info" %}
Leave the Y-Axis Maximum field empty to allow TilliT to automatically scale the axis based on your data. This is useful if your data values change frequently.
{% endhint %}
## Editing Dashboard Groups
Go to Settings > Configuration > Dashboard Groups.
Click on the group you want to edit.
Edit the name in the Basic Information section of the group.
## Create a Station Dashboard
See this video to see how to create a simple dashboard and link it to your asset.
{% embed url="" %}
## Deleting Dashboards
To be able to delete dashboards, you need to delete **every element** within your dashboard.
Click on Dashboard Options button with the edit icon, then your dashboard should be in an editable state.
Click on the edit pen button next to the element's name.
Click Delete on the top right of the element's configuration page.
Repeat this with **all elements** in your dashboard. Then click on the Settings button next to the dashboard's name and click on Delete Dashboard.
## Deleting Dashboard Groups
To do this, make sure you have deleted all dashboards within that group following this steps from [#deleting-dashboards](#deleting-dashboards "mention").
Go to Settings > Configuration > Dashboard Groups.
Select the Dashboard Group you want to delete, then click the top right drop down and delete.