> For the complete documentation index, see [llms.txt](https://help.tillit.cloud/tillit/llms.txt). Markdown versions of documentation pages are available by appending `.md` to page URLs; this page is available as [Markdown](https://help.tillit.cloud/tillit/knowledge-base/scheduler/live.md).
# Live Scenario
Monitor and manage the active production schedule in real time.
The Live Scenario is the single active scenario whose orders are synchronised with TilliT Digital Operations for execution. It provides real-time visibility into production progress, enabling schedulers to monitor and adjust the schedule as conditions change.
## Navigation
The Live Scenario can be accessed in two ways, each providing a different level of interaction:
| Access Method | Path | Mode | Use Case |
| ------------------ | --------------------------------------------------------- | --------- | ----------------------------------------------------------------------------------------- |
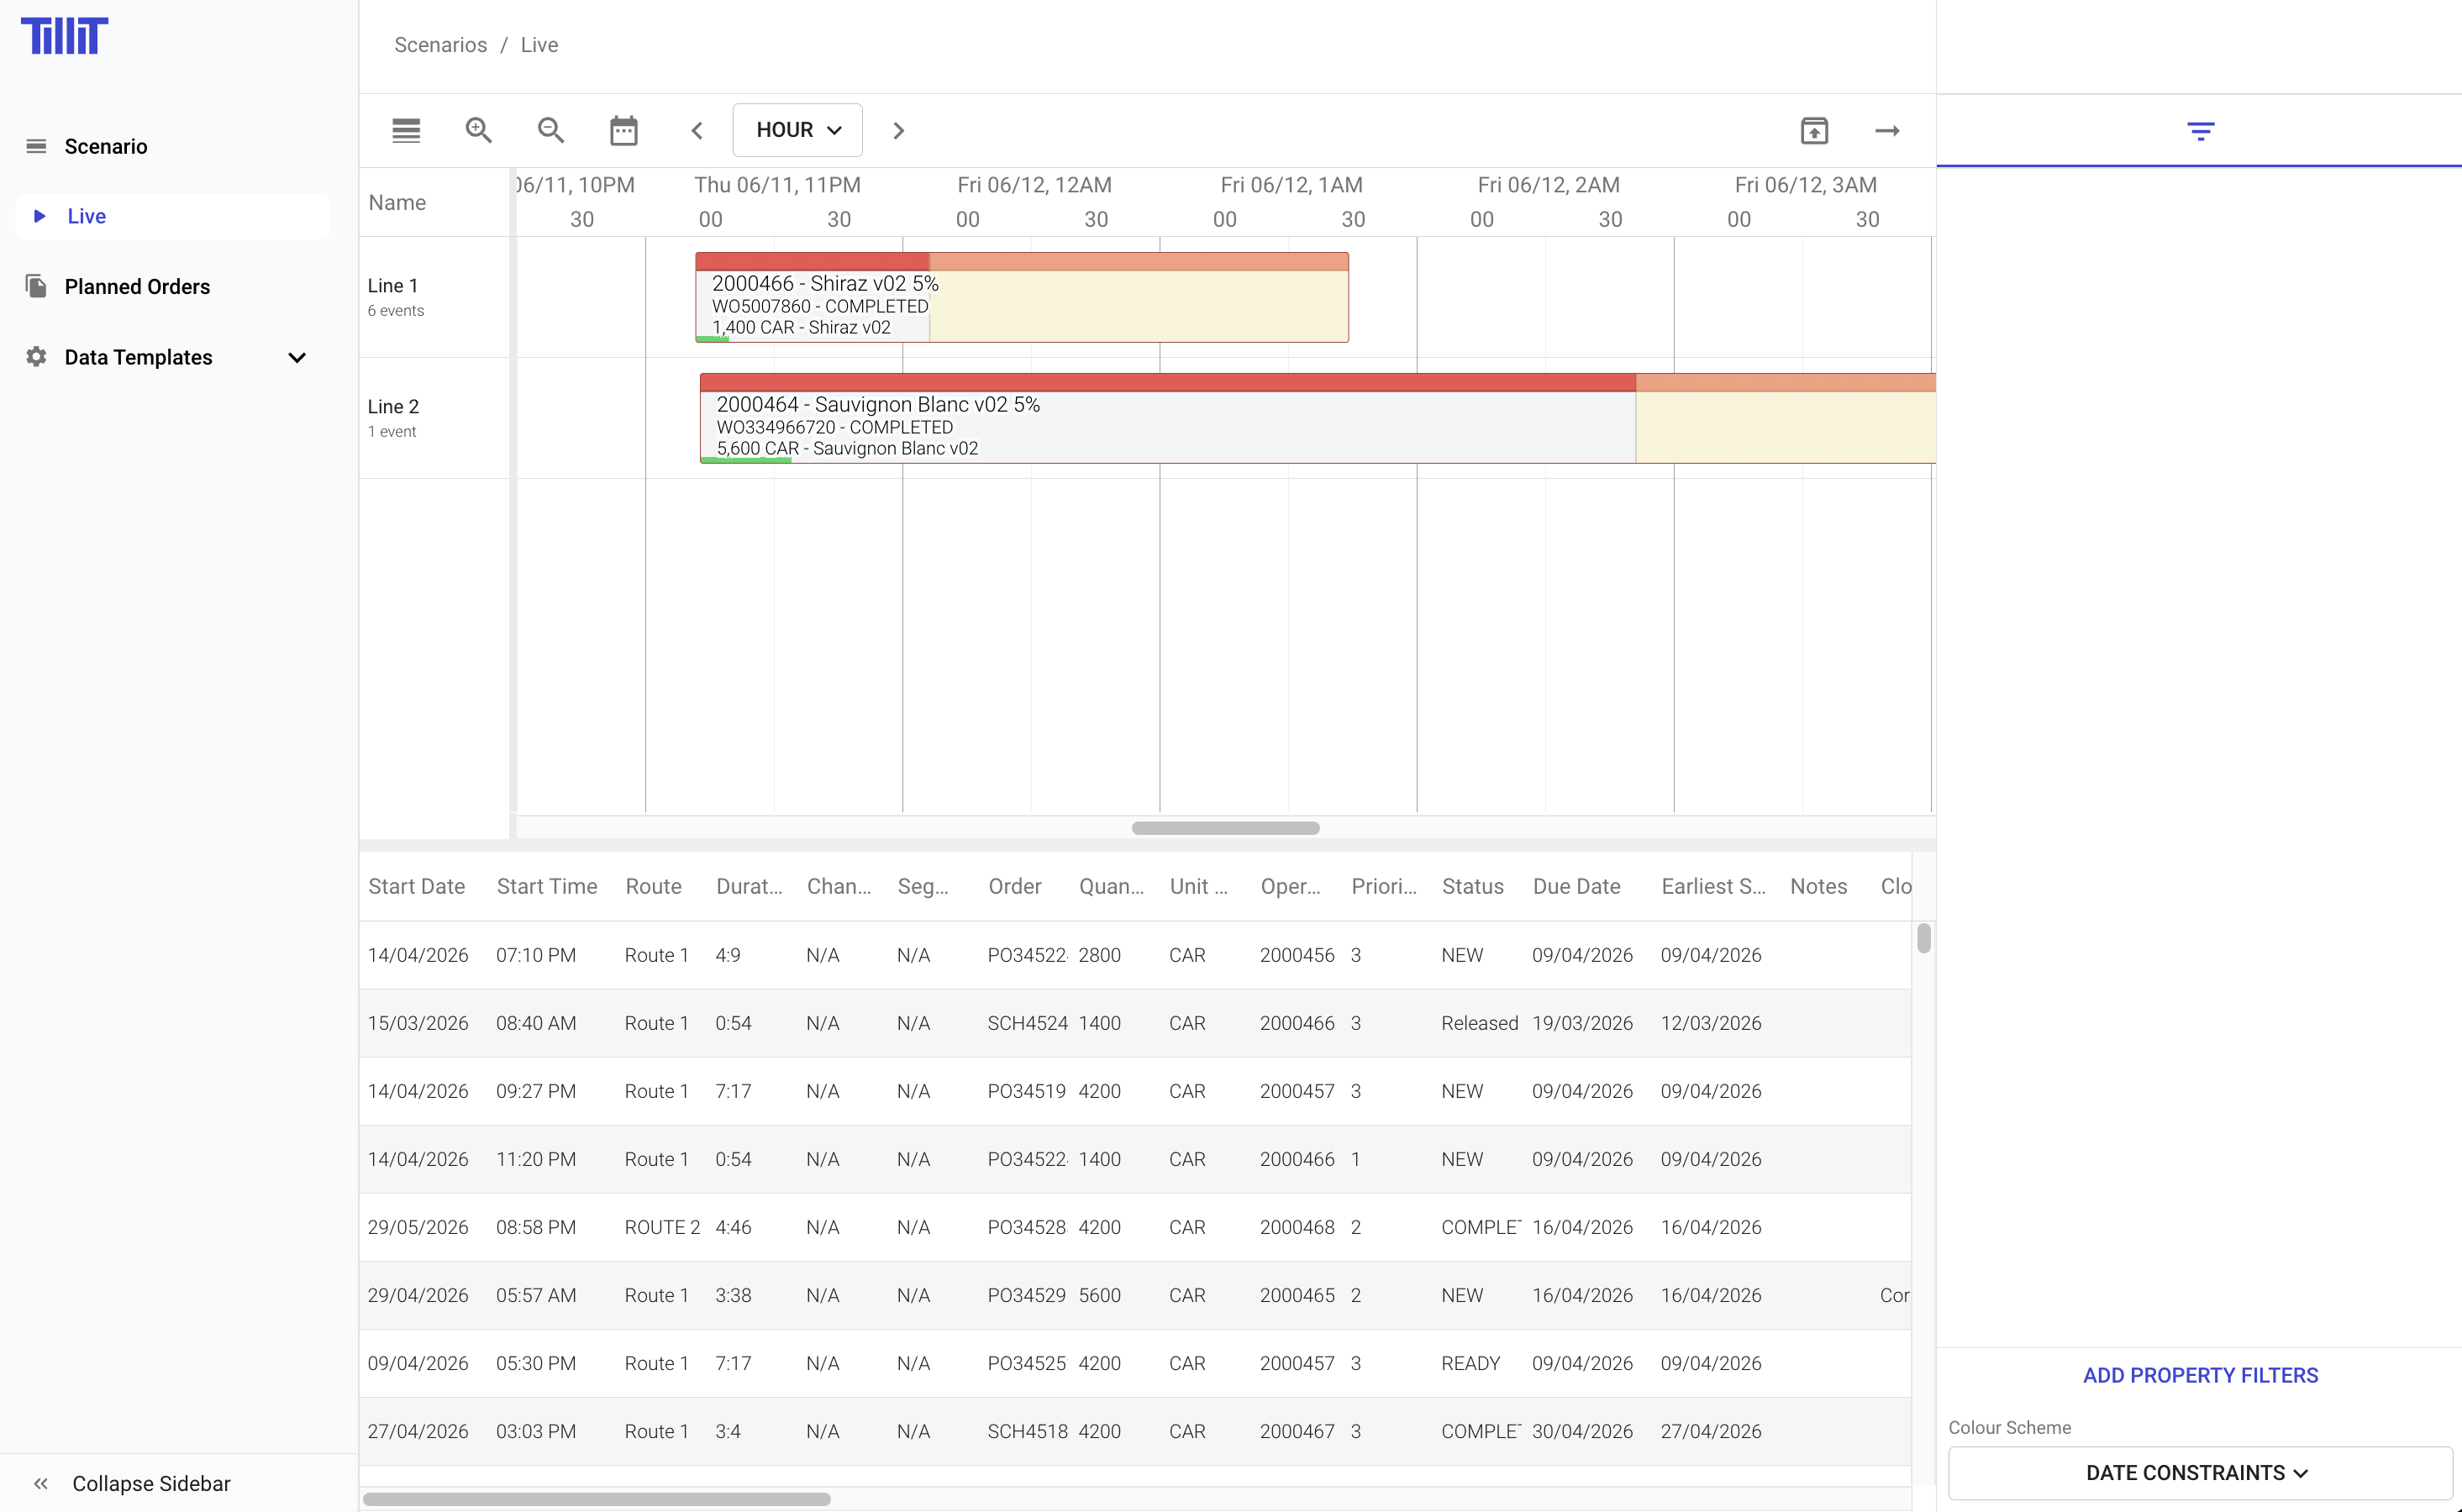
| **Sidebar** | ***Scheduler*** > ***Live*** | Read-only | Presentations, monitoring, a simpler view of the current schedule |
| **Scenario board** | ***Scheduler*** > ***Scenario*** > open the Live scenario | Editable | Adding orders, enabling Auto Shift, editing allocations, and all other scheduling actions |
{% hint style="info" %}
To make changes to the Live Scenario — such as adding new orders, enabling Auto Shift, or editing allocations — you must open it from the Scenario Kanban board, not from the sidebar.
{% endhint %}
## Overview
The Live Scenario view shows the scheduling Gantt chart with all currently active and upcoming orders. From here you can:
* Monitor order progress in real time
* Add new orders directly to the live scenario
* View order details and execution status
* Manage downtime allocations
* Compare scheduled vs actual performance
## Adding Orders on the Live Scenario
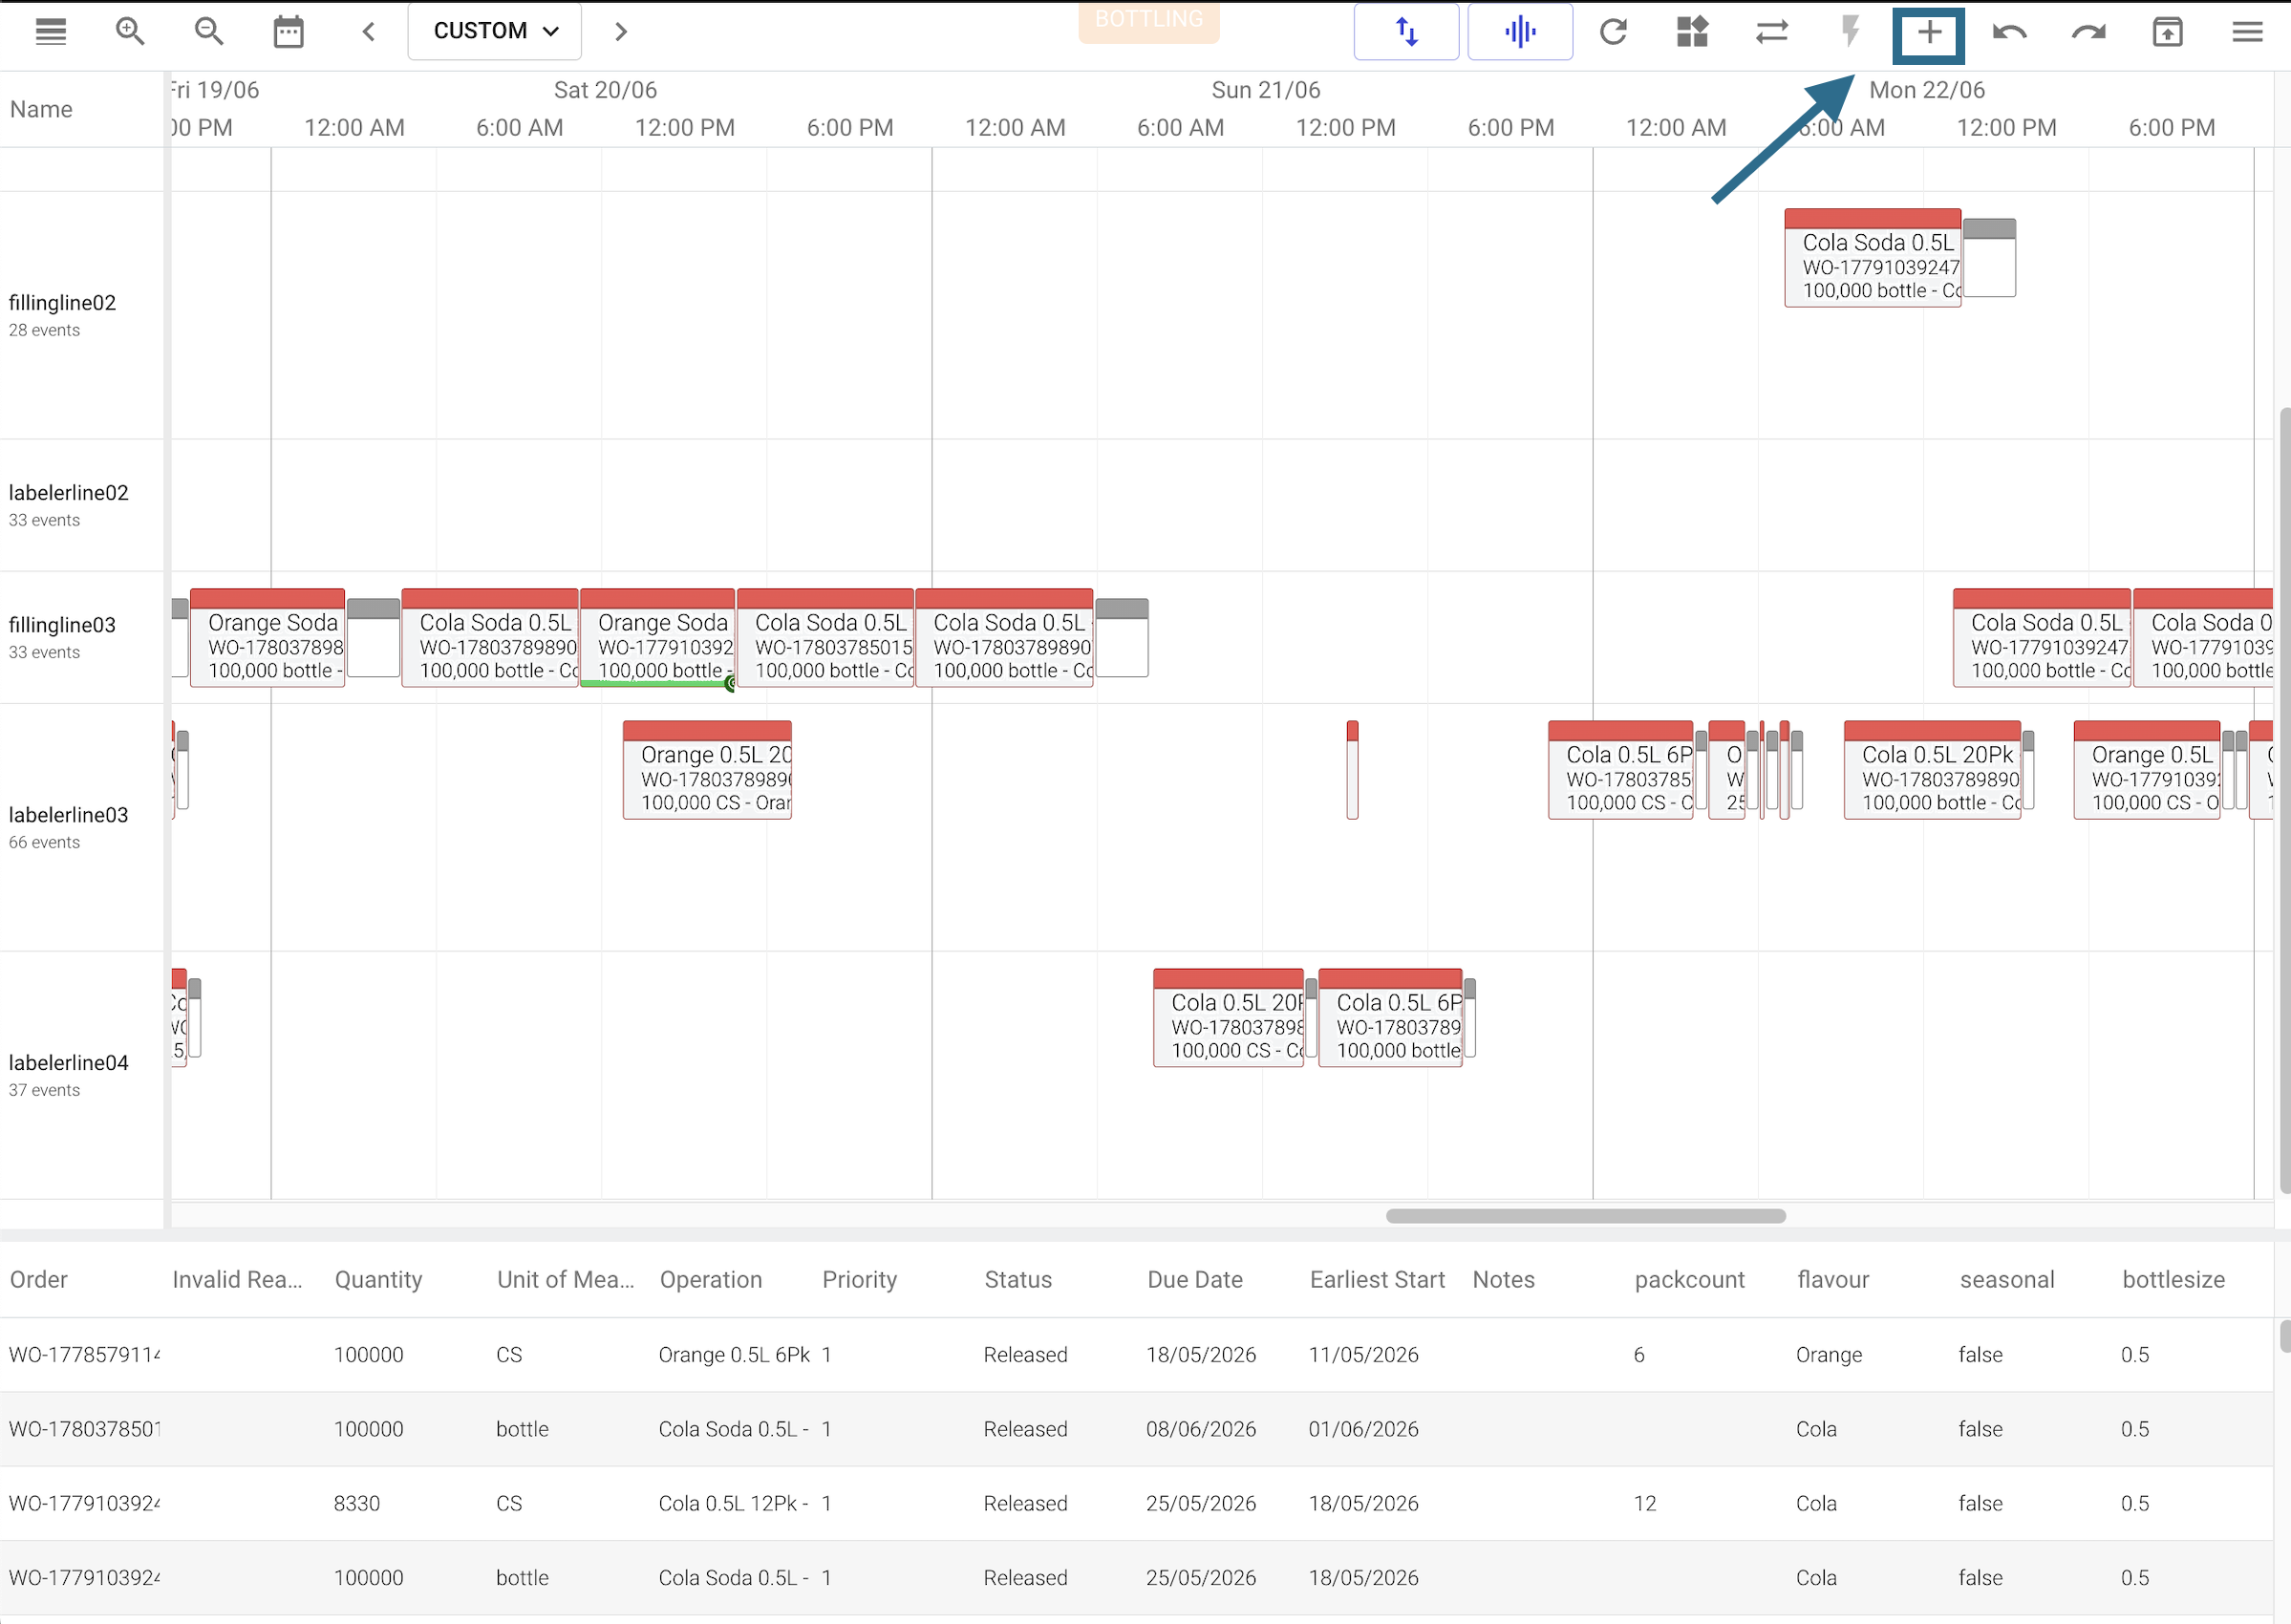
You can add new orders directly to the Live Scenario. Click the **+** button at the top of the scheduler to open the Orders Store, select orders, and add them to the schedule.
{% hint style="info" %}
Only orders that have not been previously added to the scenario are visible in the Orders Store.
{% endhint %}
## Order Allocations
### Order Tooltip — Verbose Mode
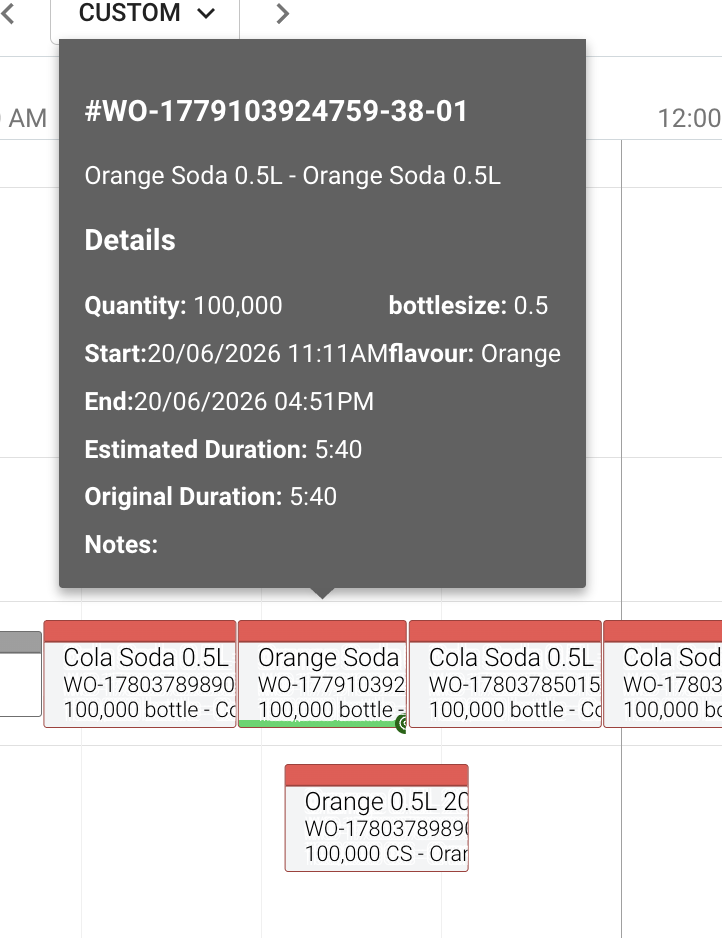
Hovering over a scheduled order displays a tooltip with the following information:
| Field | Description |
| --------------------------------------------------------------------------------------------- | ------------------------------------------------------------------------ |
| **Quantity** | Target production quantity |
| **Order Attributes** | Order attributes (visible when Digital Operations integration is active) |
| **Start Time** | Scheduled start time |
| **End Time** | Scheduled end time |
| **Estimated Duration** | Expected duration based on current calculations |
| **Original Duration** | Originally scheduled duration |
| **Notes** | Any notes attached to the order |
| When Compact Mode is enabled, tooltips show only order number, operation, start and end times | |
### Progress Visual Indicators
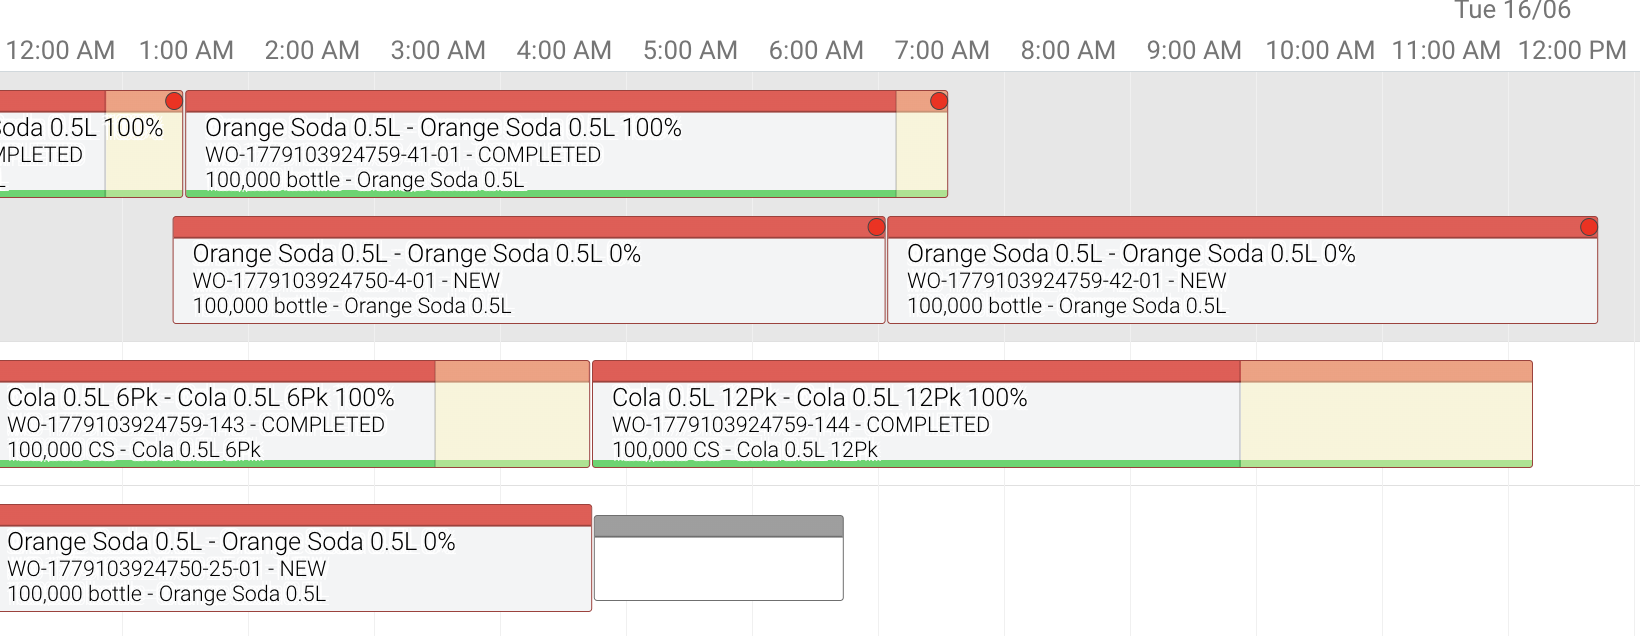
Scheduled orders on the Gantt chart display colour-coded progress bars:
| Indicator | Description |
| ---------------------------------------------------- | --------------------------------------------------------------------------------------------------------------------------------------------------- |
| **Light green bar** | Actual progress — shows real completion percentage |
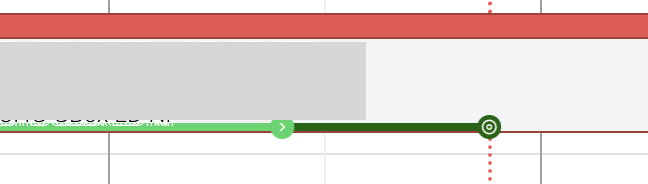
| **Dark green bar** | Target progress — where production should be based on the scheduled or default run rate. Hidden when target quantity or run rate are not configured |
| **Yellow tail** | Delay indicator — shows the gap between the estimated duration and the actual duration of the order |
| Example 1 where there are delays and no target rate: | |
Example 2 where the actual running rate is behind the target rate:
### Allocation Popper
{% hint style="info" %}
This is only available in editable Live Scenario mode.
{% endhint %}
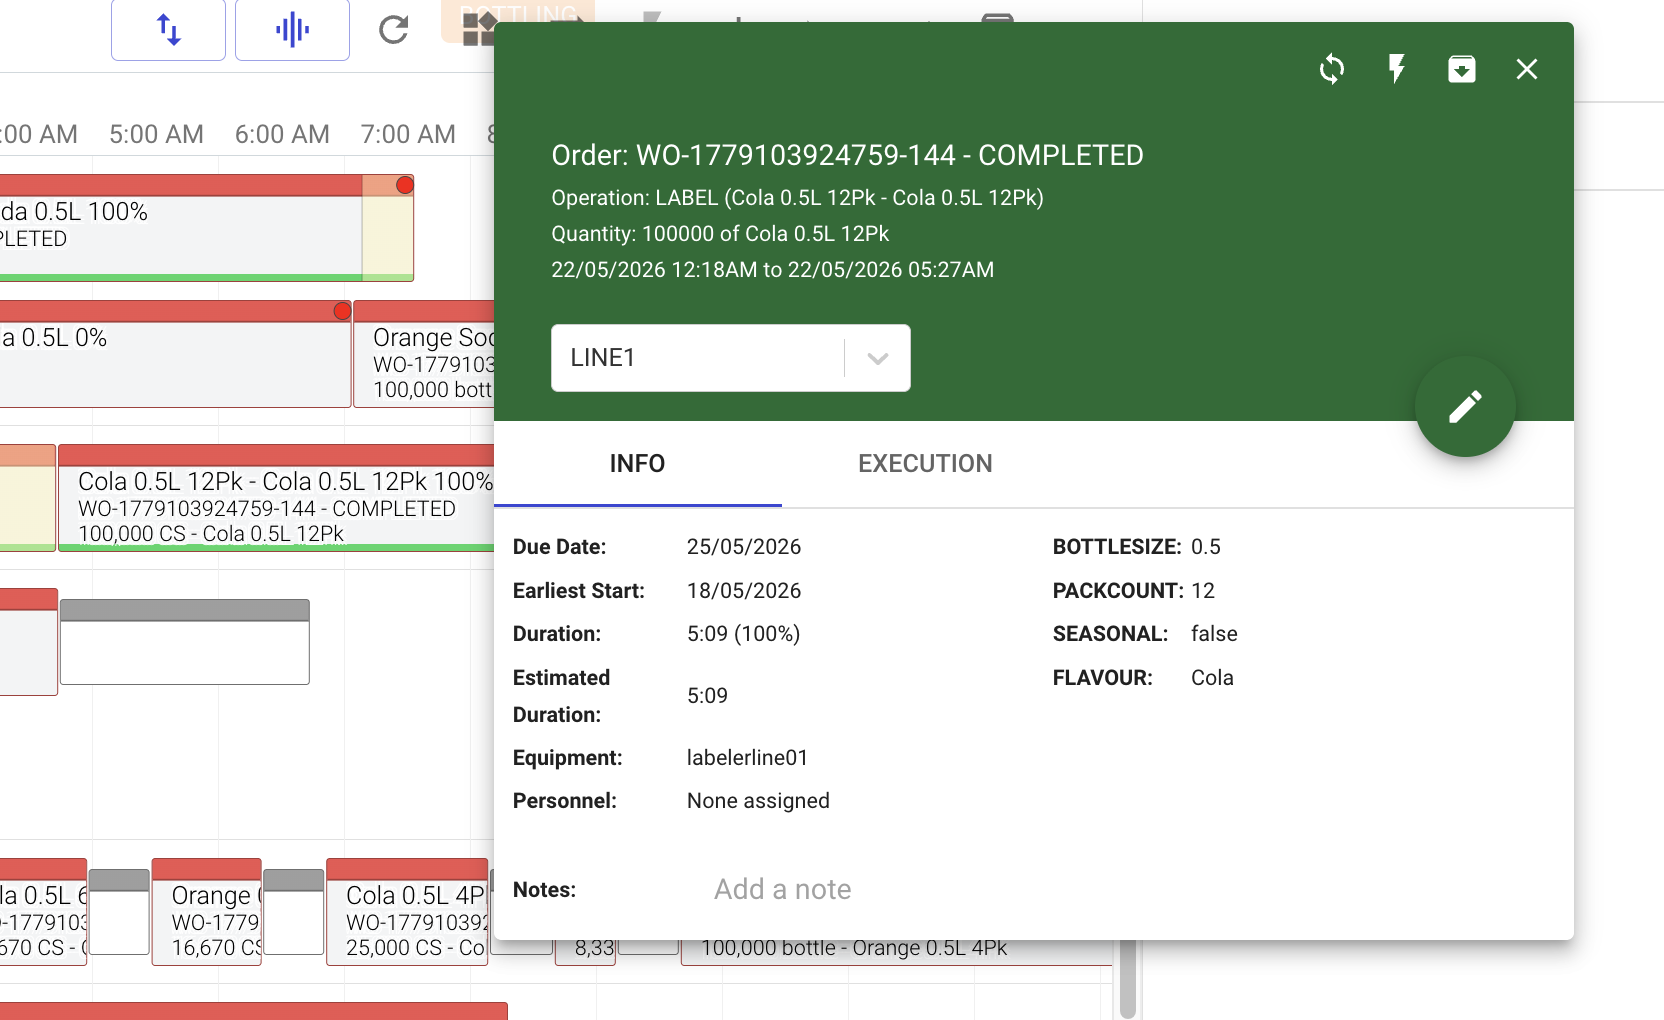
Click on a scheduled order to open the Allocation Popper, which provides detailed information across two tabs.
#### Info Tab — Regular Allocations
| Field | Description |
| ---------------------- | ----------------------------------------------------------------- |
| **Due Date** | The order's required completion date |
| **Earliest Start** | Earliest the order can begin |
| **Duration** | Scheduled length (hh:mm), with efficiency factor percentage shown |
| **Estimated Duration** | Expected duration if it differs from the scheduled duration |
| **Equipment** | Assigned machines and resources |
| **Personnel** | Assigned people |
| **Order Properties** | Custom key-value attributes on the order (e.g. COLOR, SIZE) |
| **Notes** | Editable free-text note on the allocation |
#### Info Tab — Changeover Allocations
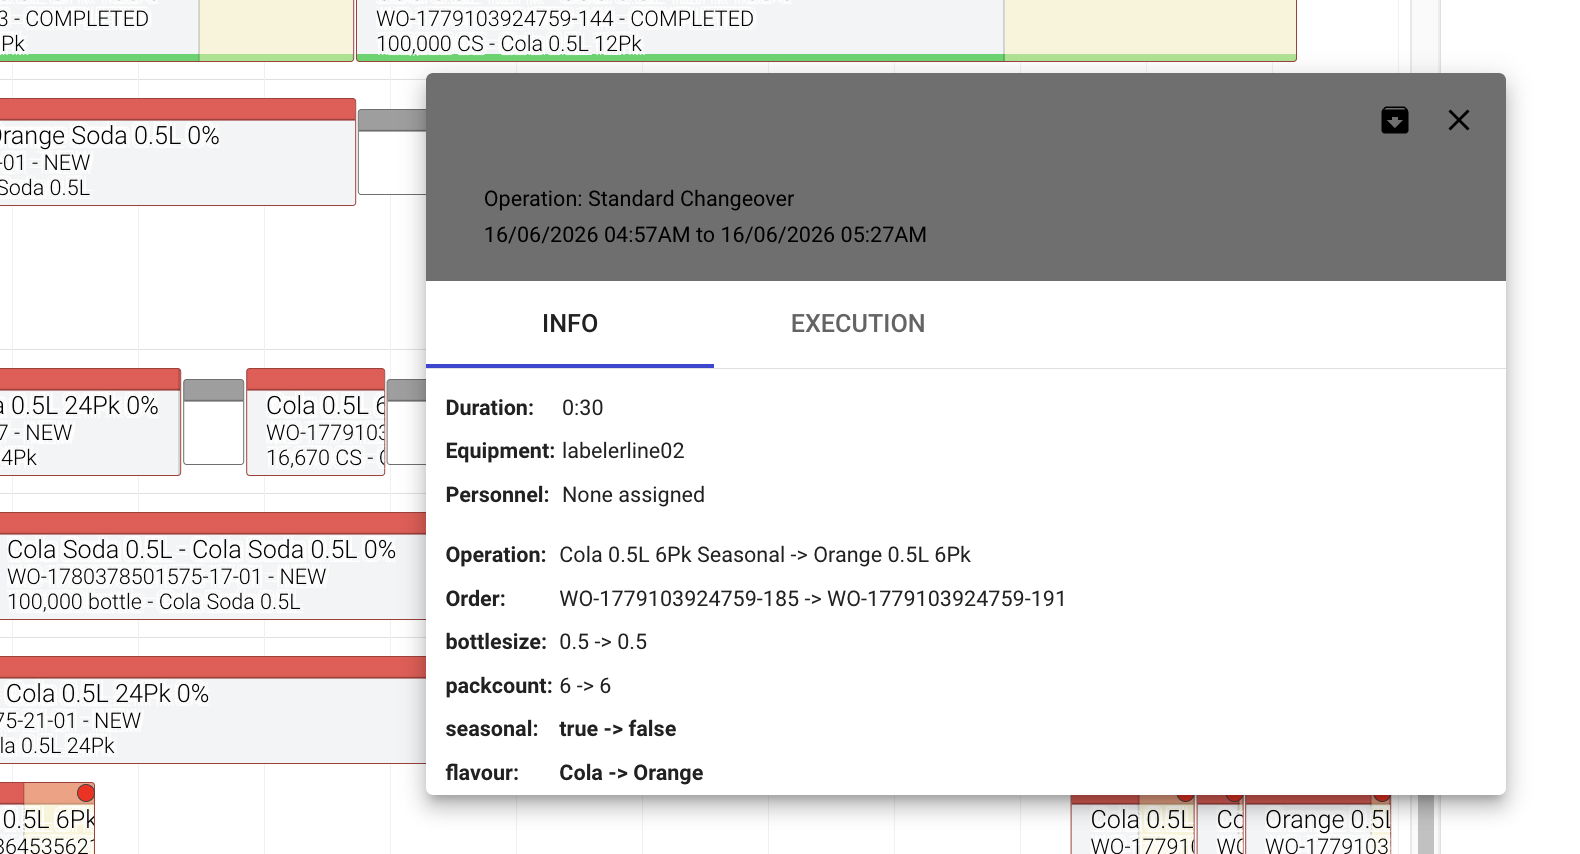
For changeover operations between two orders, the Info tab shows:
| Field | Description |
| ------------------------- | ----------------------------------------------------------------------------------------- |
| **Duration** | Changeover length |
| **Equipment / Personnel** | Assigned resources |
| **Operation** | Transition shown as "from operation → to operation" |
| **Order** | Transition shown as "from order → to order" |
| **Material Properties** | Before and after values for any properties that changed. Changed values are shown in bold |
#### Execution Tab
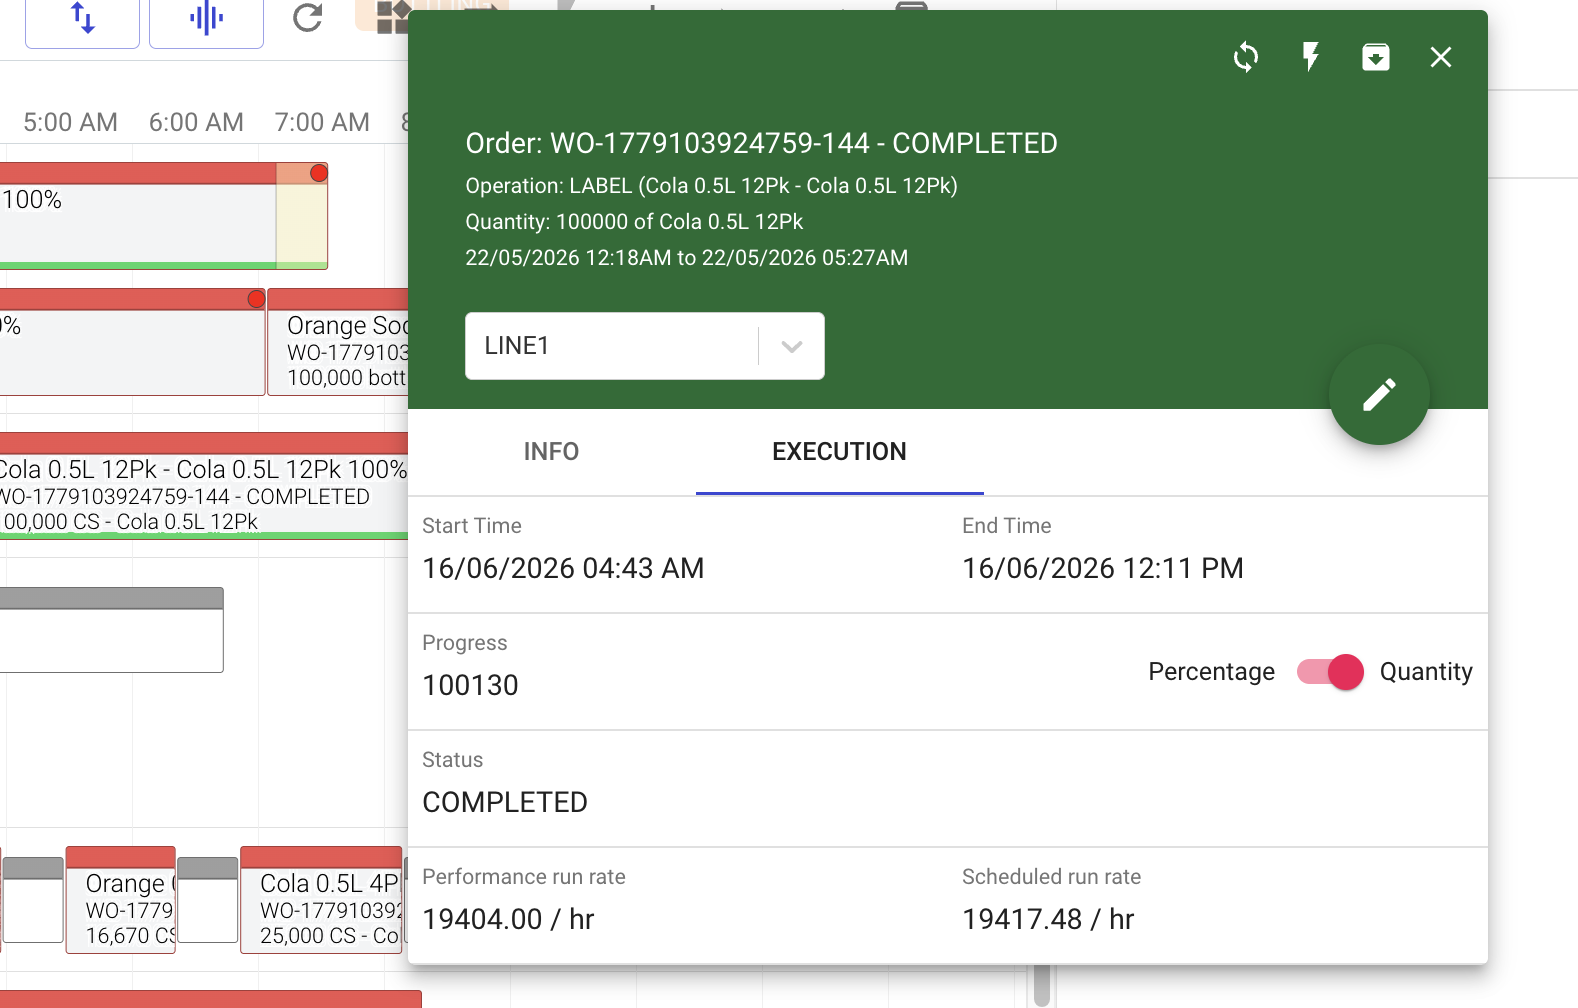
The Execution tab tracks actual vs scheduled performance:
| Field | Description |
| ------------------------ | ------------------------------------------------------------------- |
| **Start / End Time** | Actual recorded start and end times (editable) |
| **Progress** | Completion amount shown as quantity units |
| **Status** | Current state: In Progress, Paused, or Complete |
| **Performance Run Rate** | Actual throughput (units/hour) derived from real execution data |
| **Scheduled Run Rate** | Planned throughput (units/hour) from the scheduling configuration |
| **Delayed By** | How much the actual duration exceeded the expected duration (hh:mm) |
### Estimated Duration Calculation
The system calculates the estimated duration for an order using:
```
Estimated Duration = Fixed Base Time + (Quantity to Produce / Throughput Rate) / Number of Assignments
```
| Component | Description |
| ------------------------- | ---------------------------------------------------------------------------------------- |
| **Fixed Base Time** | Non-throughput time built into the segment (e.g. setup or changeover) |
| **Quantity to Produce** | Total units multiplied by the percentage of work remaining |
| **Throughput Rate** | Units per second the resource can produce, from the operation's throughput configuration |
| **Number of Assignments** | More people assigned means the duration divides down proportionally |
{% hint style="info" %}
If an efficiency factor is set on the order, the result is further divided by it. A lower efficiency value (e.g. 0.5 = 50%) increases the duration, while a higher value (e.g. 1.25 = 125%) shortens it.
{% endhint %}